Latest UK car theft statistics 2025
With this in mind, Zego has compiled the latest car theft statistics for 2025 to show how trends have evolved in the world of vehicle crime and suggest what the future may hold for those looking to protect their vehicles in the years to come.
Top 10 must-know UK car theft statistics 2025
01
In the year ending September 2024, there were 375,048 reported vehicle thefts across England and Wales, equating to roughly 6.2 thefts per 1,000 people.02
The Ford Fiesta was the most stolen car in the UK as of 2024, with 4,446 reported thefts throughout the year.03
Reported car thefts are predicted to drop by around 2% between 2024-26.04
More than a quarter (28.1%) of reported car thefts are in London, with 105,211 in the year ending September 2024.05
France has the highest rate of vehicle theft in Europe, with 248 per 100,000 people, compared to the UK in seventh with 142 per 100,000 residents.06
The median average cost of damage from vehicle theft was £200 in 2022-23 and is forecast to reach £238 by 2026-27.07
An estimated two-fifths (40%) of damage caused by vehicle theft in 2024-25 was between £100 and £149.08
Found in more than nine in 10 (93%) of vehicles, central locking remains the most common security feature in vehicles across England and Wales.09
Just under half (46%) of reported attempts at vehicle theft in 2022-23 were via an unlocked door – the most common method of entry for criminals.10
The most commonly stolen age of a vehicle in 2022-23 was between the ages of five and 10, accounting for almost two-fifths (39%) of reported vehicle theft that year.
How many cars are stolen in the UK?
England and Wales vehicle theft statistics
In the year ending September 2024, there were 375,048 reported vehicle thefts across England and Wales. The vast majority (96.4%) were in England, accounting for 361,493 incidents.
With a combined estimated population of almost 60.9 million (as of 2023), this equates to around 6.2 vehicle theft offences per 1,000 people across England and Wales.
When broken down by country, England’s population of approximately 57.7 million generates a vehicle theft rate of 6.3 incidents per 1,000 residents compared to 3.7 vehicle thefts per 1,000 people in Wales.
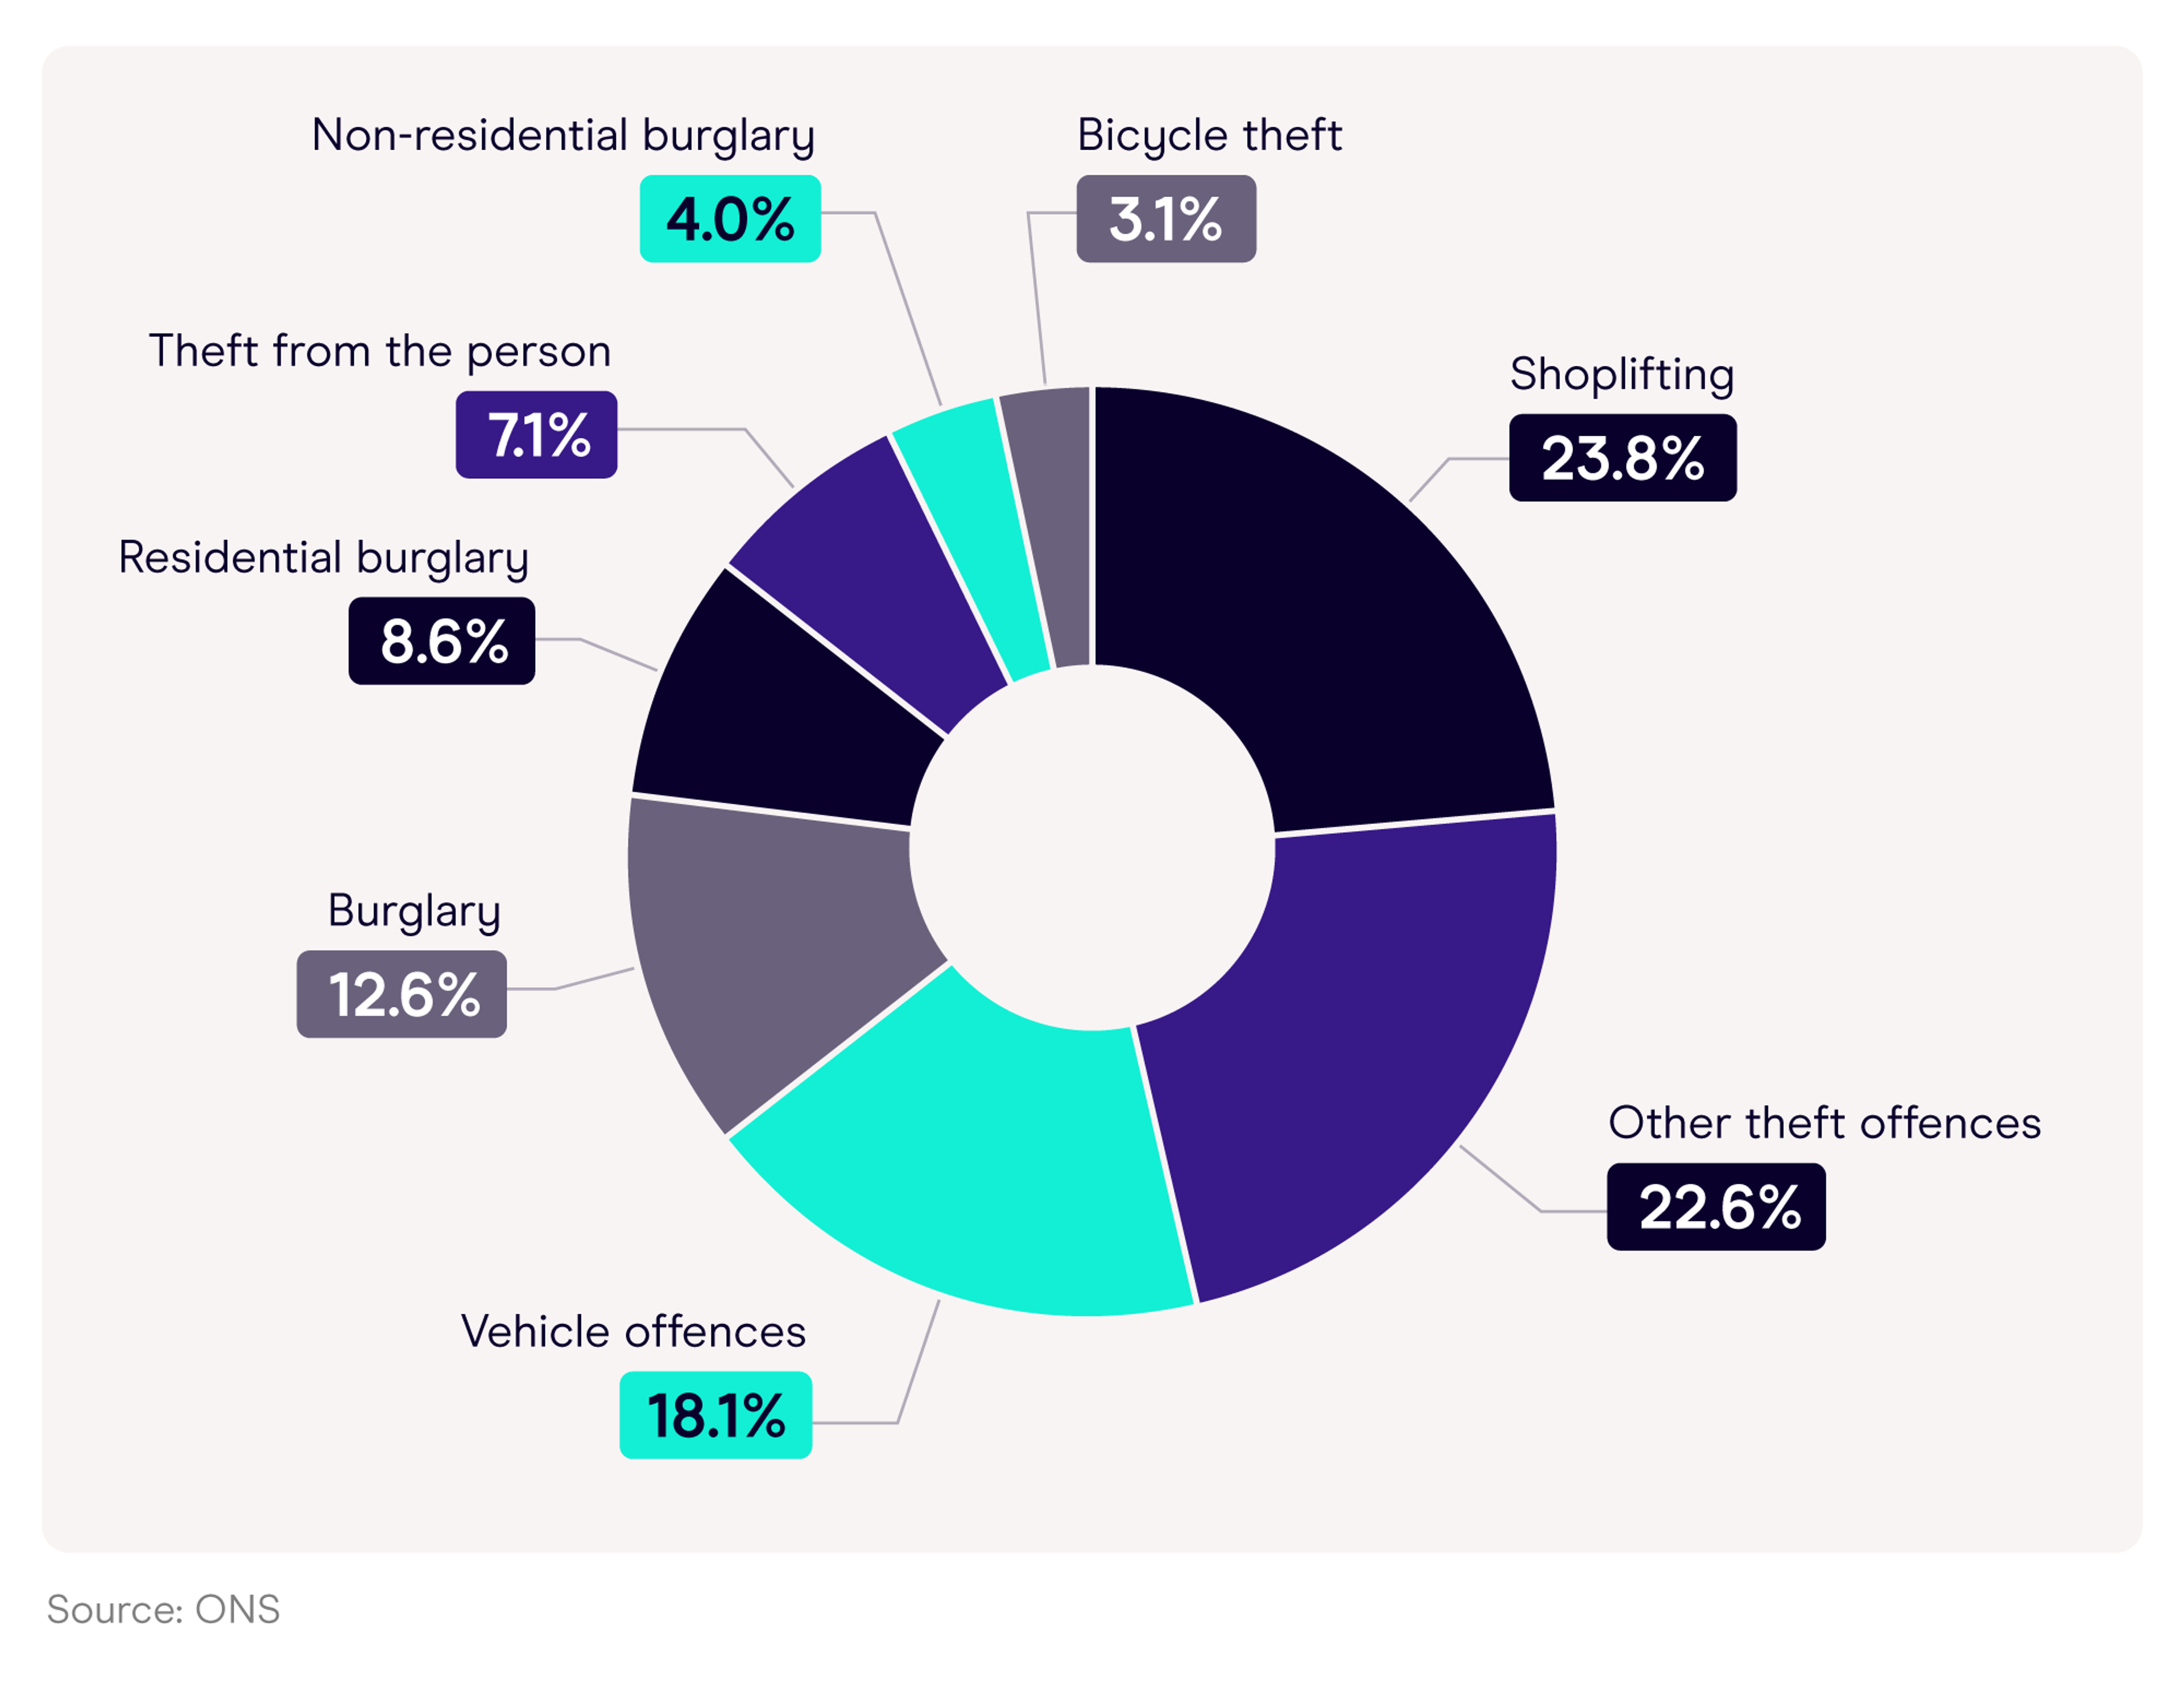
^ Number of reported vehicle thefts compared to other theft offences across England and Wales (2023-24)
In the 12 months to September 2024, there were just over two million theft offences reported across England and Wales. Just under a fifth (18.1%) of these were vehicle-related incidents – the third highest after other theft offences (22.6%) and shoplifting (23.8%).
In all, people in England and Wales were almost twice as likely to report vehicle theft between September 2023 and September 2024 compared to a residential burglary (8.6%).
Vehicle theft statistics in Scotland
In Scotland, Crimes of dishonesty is the largest category of reported crime, accounting for almost two-fifths (37%) of all recorded crime in 2023-24.
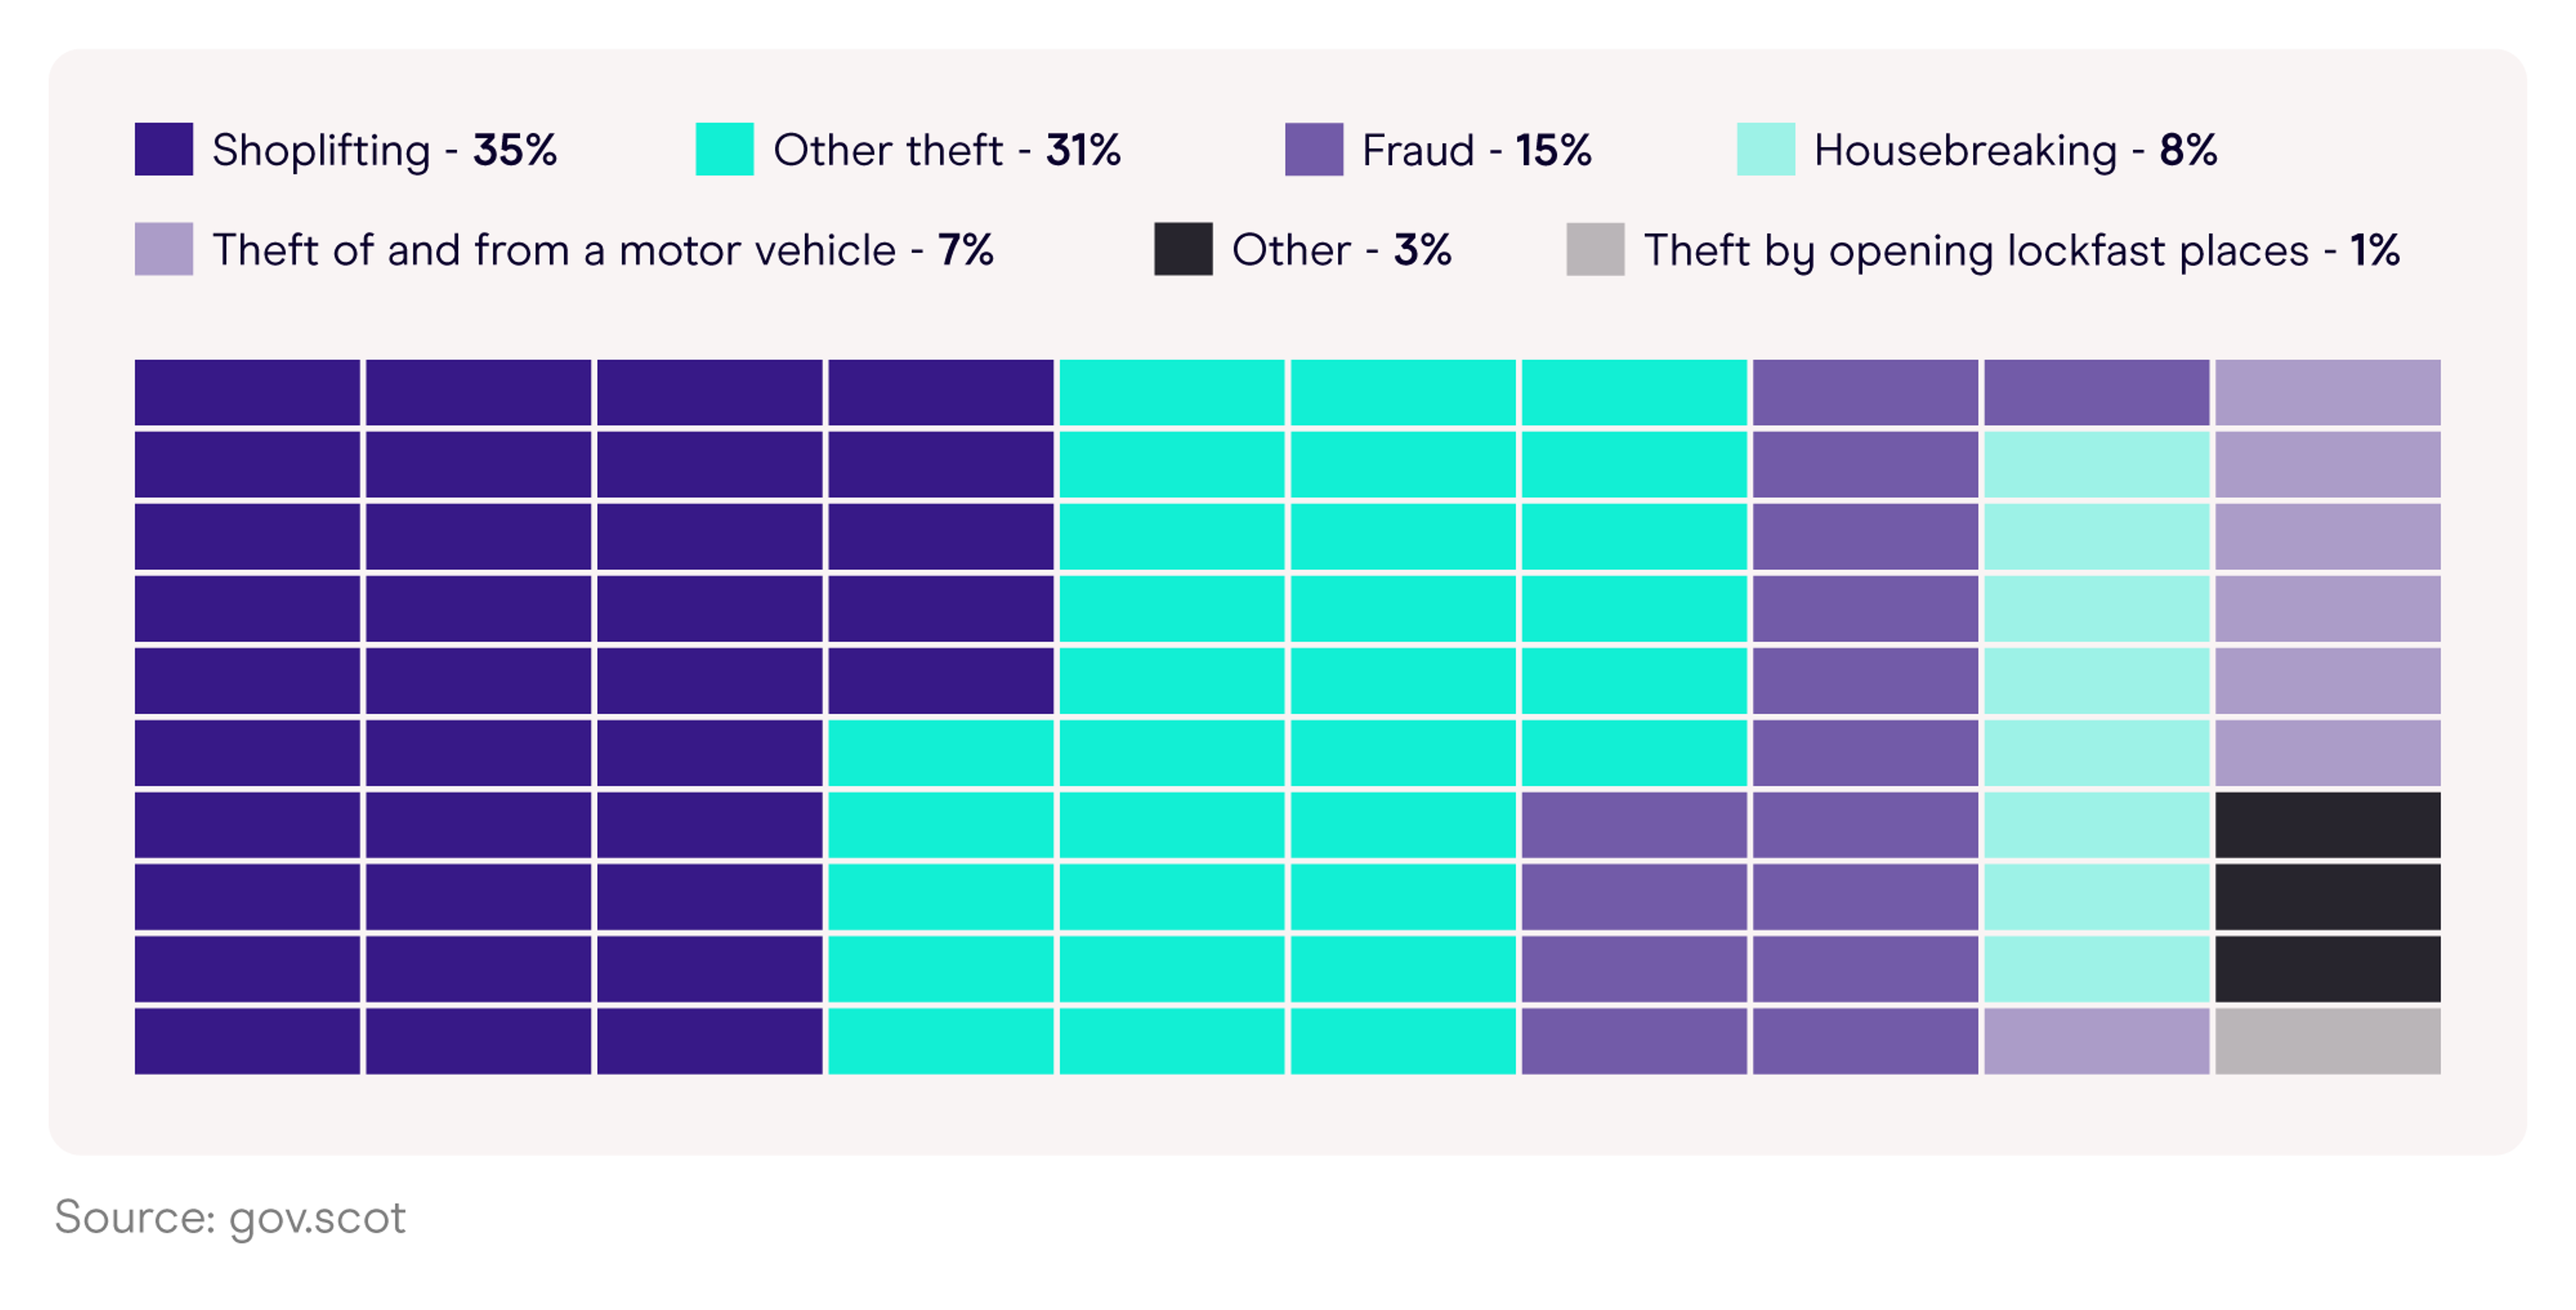
^ Most common Crimes of dishonesty in Scotland (2023-24)
Less than one in 10 (7%) reported Crimes of dishonesty throughout 2023-24 were attributed to theft of and from a motor vehicle, compared to more than a third (35%) for shoplifting – the most commonly reported crime from this category.
In all, people in Scotland are around twice as likely to report an incident of fraud compared to the theft of/from a motor vehicle.
Theft from a motor vehicle accounted for 2% of Crimes of dishonesty in 2023-24. Over the previous 10 years, reports for this crime dropped by around three-fifths (61%). However, there was a 9% jump between 2022-23 and 2023-24 from 2,061 to 2,251 reported cases.
By contrast, theft of a motor vehicle was around twice as common in 2023-24, accounting for around 5% of Crimes of dishonesty for the year. Between 2014-24, reported cases of this crime dropped by 6%, with a 2% decrease between 2022-23 and 2023-24 (5,182 vs.5,090 recorded incidents).
Vehicle theft statistics in Northern Ireland
Between September 2023 and August 2024, there were 2,393 recorded incidents of vehicle theft across Northern Ireland, representing just over a tenth (10.1%) of all reported theft crimes for the year.
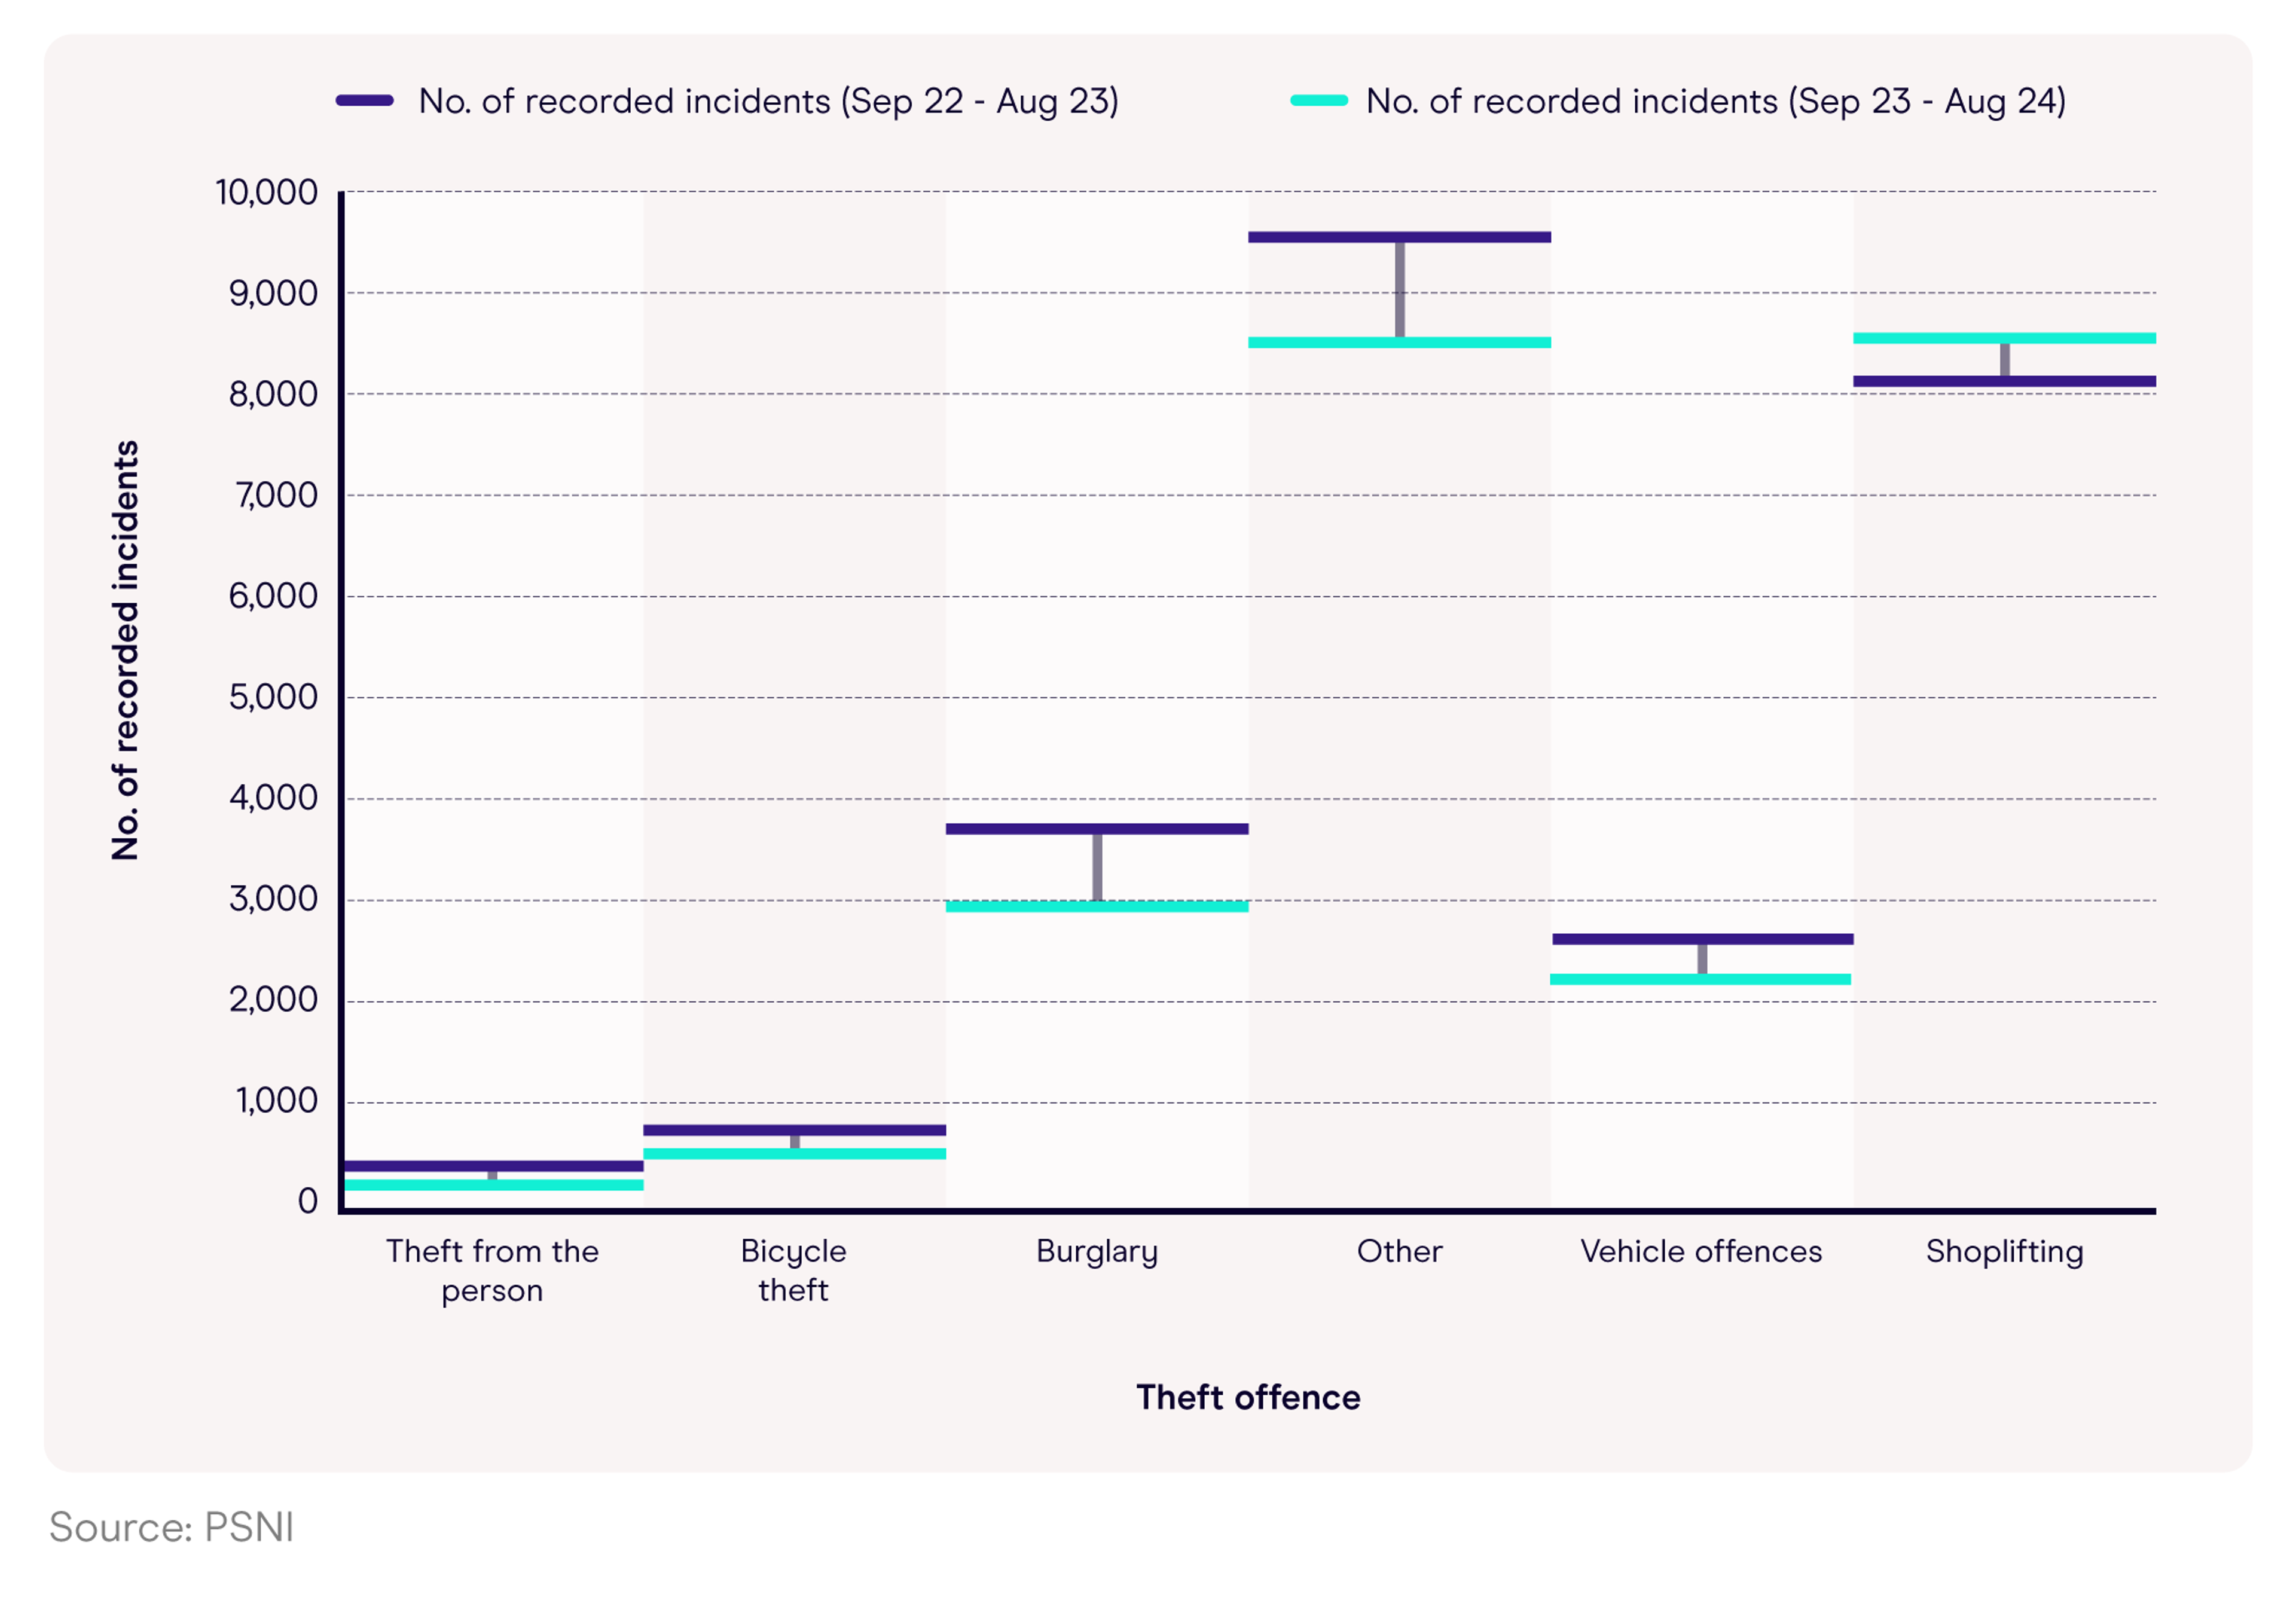
^Number of reported vehicle theft offences compared to other offences in Northern Ireland (2022-24)
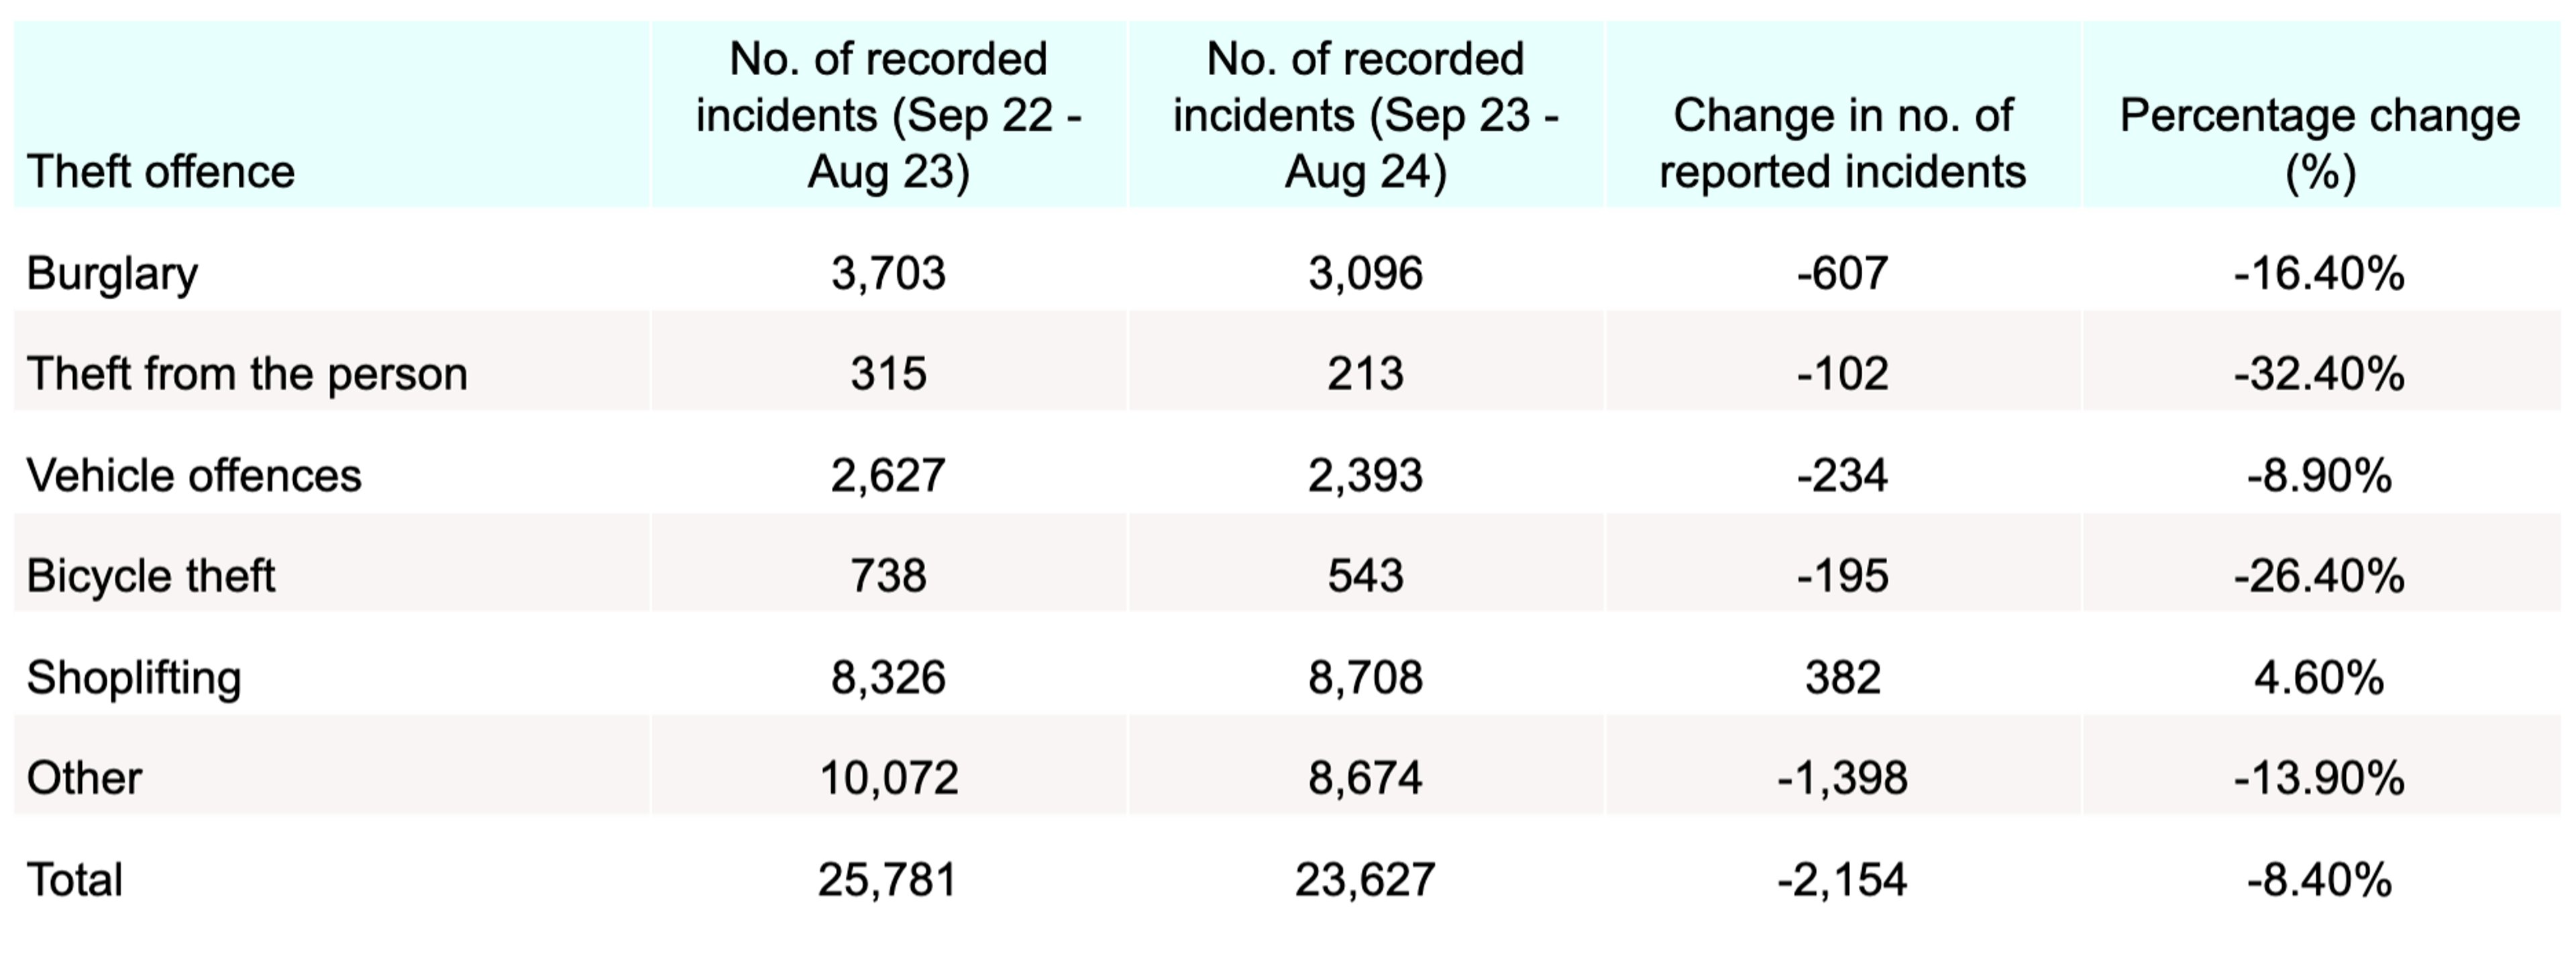
Like many other theft offences, reported vehicle-related crime decreased between 2022-24 by 8.9% – the smallest drop across all incidents of theft during this period.
UK car theft statistics by model
Most stolen cars in the UK
The Ford Focus was the third most stolen car of 2024, with 1,700 reported thefts.
Top 20 most stolen cars in the UK (2024)

In all, the top 20 most stolen cars in the UK totalled 22,489 thefts in 2024.
The Ford Kuga and Audi A3 were some of the least stolen cars in the UK for 2024, with 632 and 641 reported thefts throughout the year, respectively.
Collectively, this almost matched the number of Toyota RAV4s recorded stolen in 2024 (1,260) in fourth position.
5. BMW 3 Series (No. reported stolen; 1,243)
6. Mercedes C-Class (No. reported stolen; 1,123)
7. Range Rover Evoque (No. reported stolen; 1,087)
8. Nissan Juke (No. reported stolen; 1,027)
9. Vauxhall Corsa (No. reported stolen; 870)
10. Range Rover Sport (No. reported stolen; 867)
11. Land Rover Discovery Sport (No. reported stolen; 837)
12. Mercedes E-Class (No. reported stolen; 802)
13. Vauxhall Astra (No. reported stolen; 797)
14. BMW 1 Series (No. reported stolen; 753)
15. Mercedes A-Class (No. reported stolen; 690)
16. Lexus RX (No. reported stolen; 678)
17. Kia Sportage (No. reported stolen; 654)
18. BMW 5 Series (No. reported stolen; 651)
19. Audi A3 (No. reported stolen; 641)
20. Ford Kuga (No. reported stolen; 632)
(Source: Whatcar? via DVLA)
Why are fiestas being stolen?
Top 20 most stolen car brands in the UK (2024)
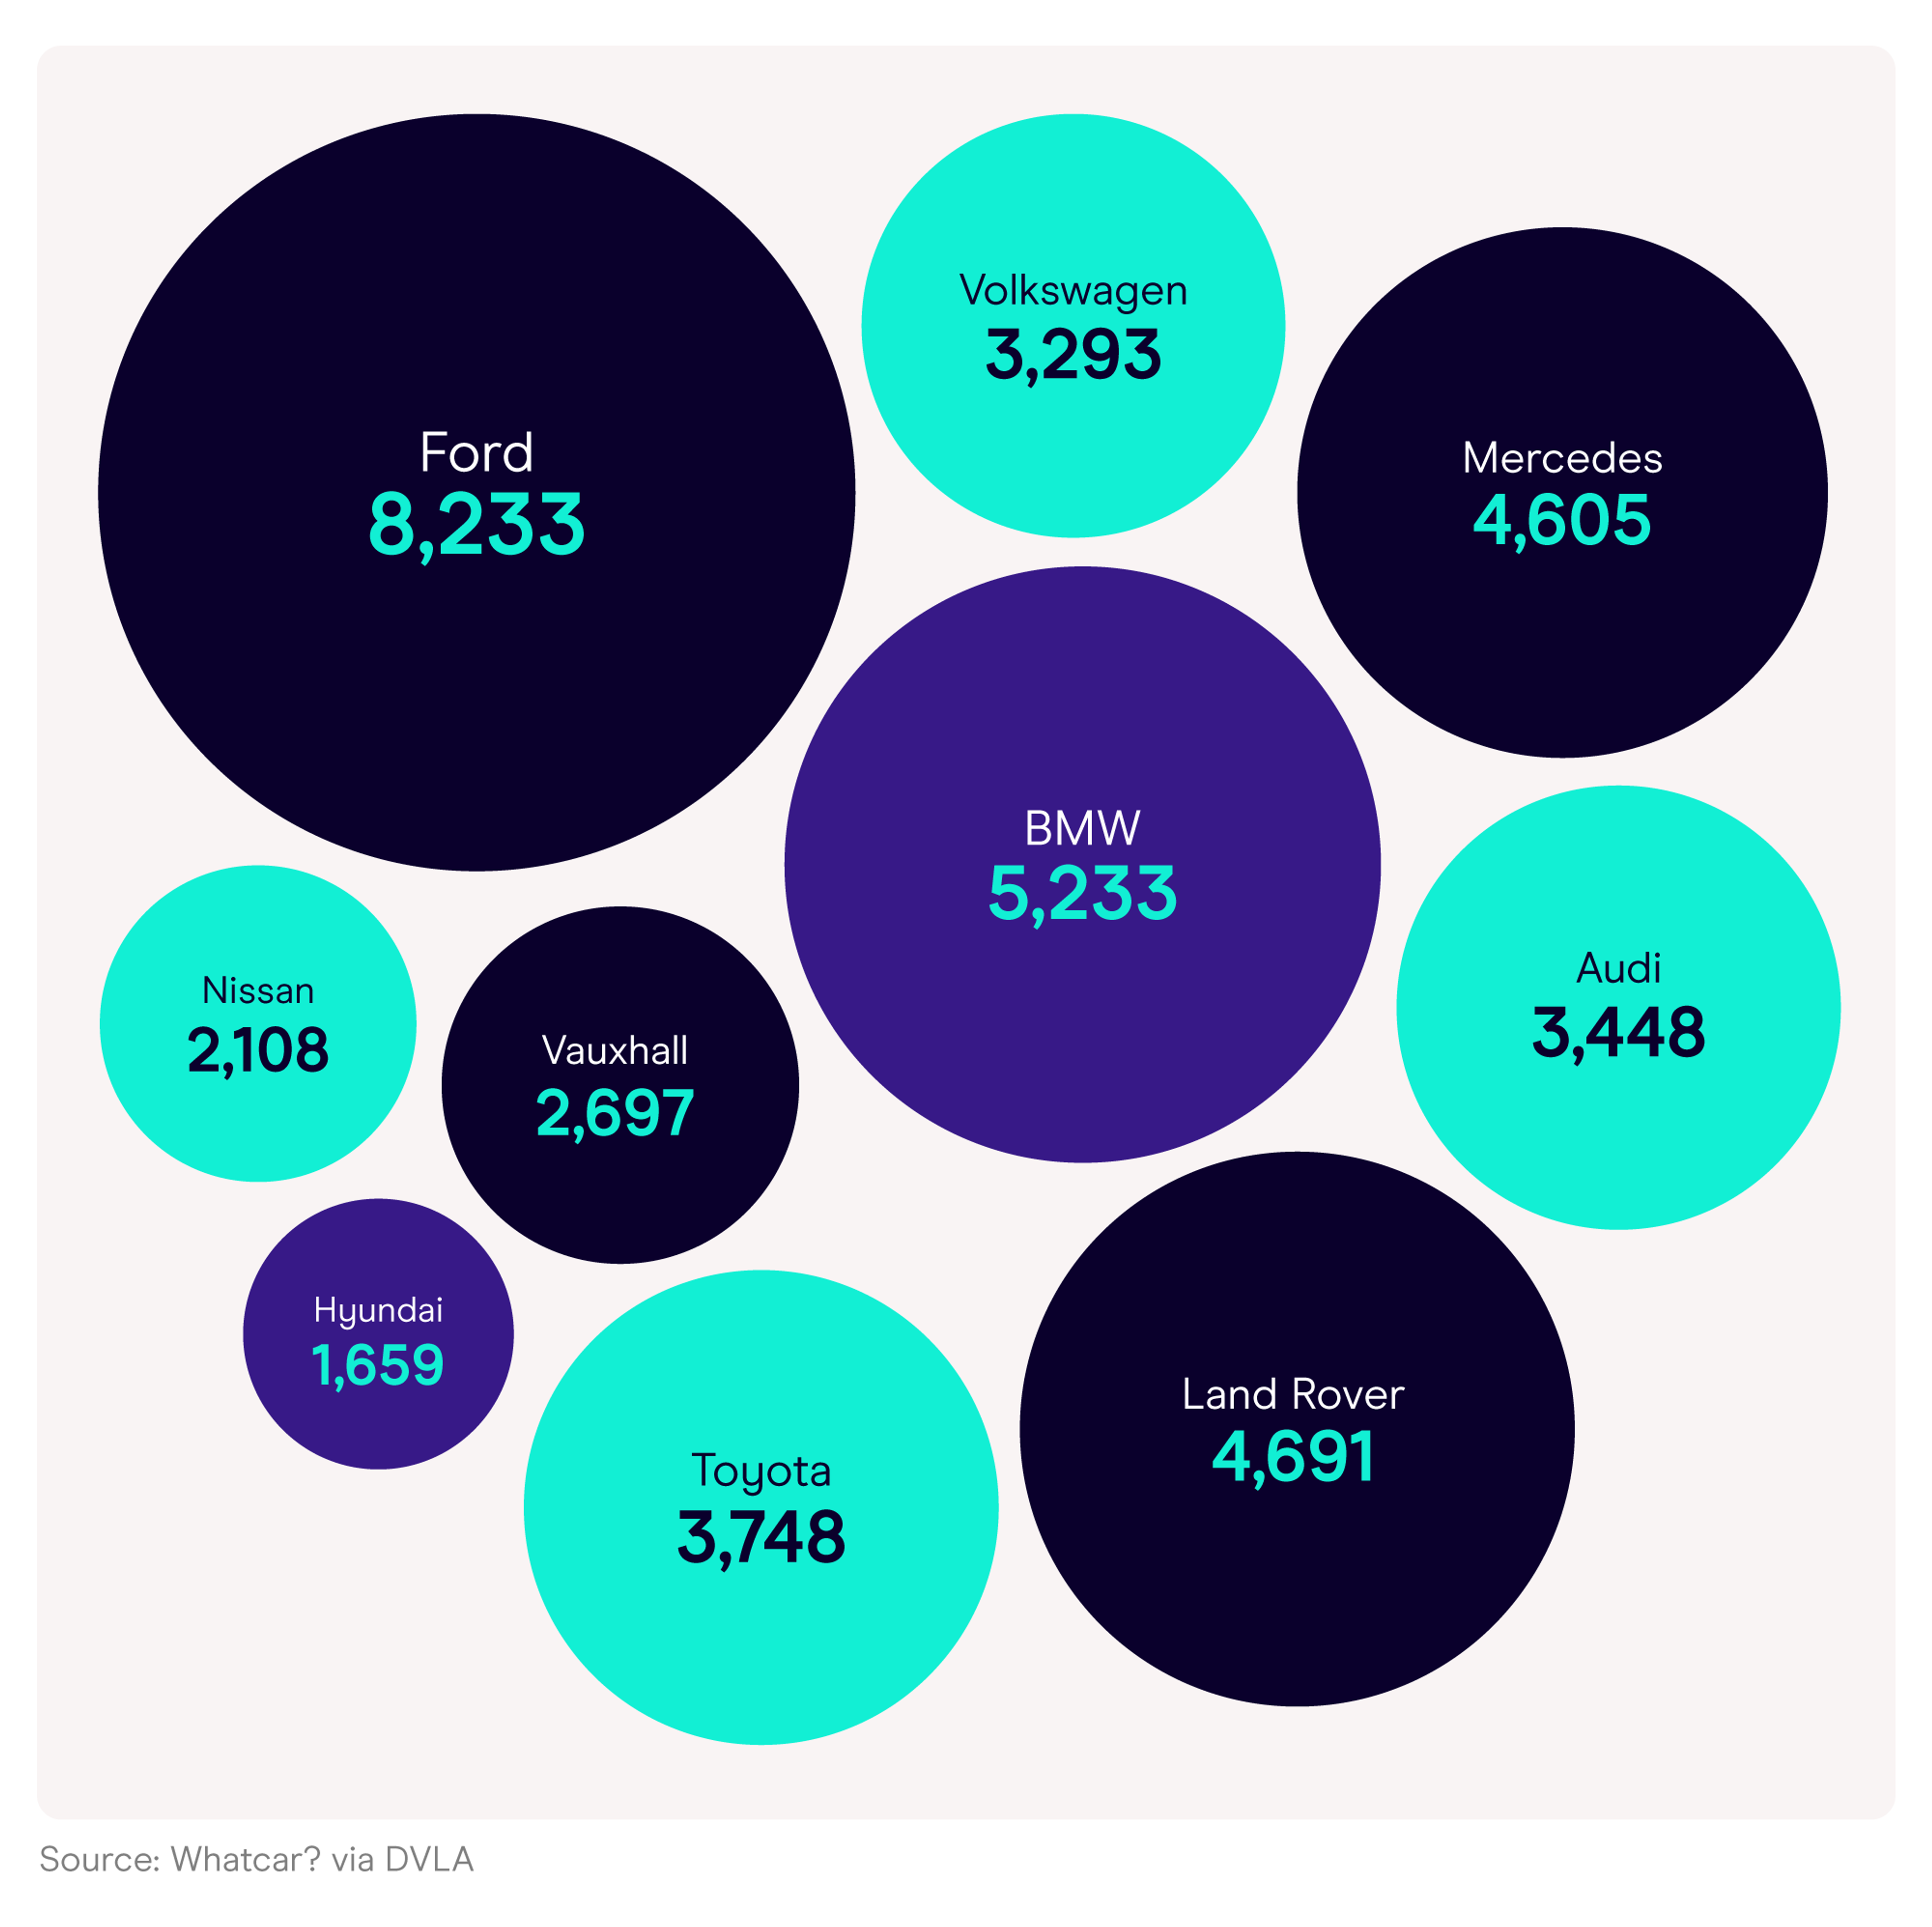
This was followed by BMW in second place (5,374) and Land Rover in third (4,691).
Conversely, Volvo was positioned last in the list, making it one of the least stolen cars in the UK, with 644 reported thefts in 2024.
12. Lexus (No. reported stolen; 1,608)
13. Jaguar (No. reported stolen; 1,312)
14. Peugeot (No. reported stolen; 982)
15. Fiat (No. reported stolen; 799)
16. Mitsubishi (No. reported stolen; 747)
17. Renault (No. reported stolen; 700)
18. Honda (No. reported stolen; 676)
19. Seat (No. reported stolen; 671)
20. Volvo (No. reported stolen; 644)
(Source: Whatcar? via DVLA)
You could also look at investing in a black box insurance policy that monitors your driving behaviour to help reduce premiums for better drivers.”
Range Rover theft rate statistics
Citing car theft statistics from the DVLA, a 2023 Bloomberg report claimed the Range Rover Velar model “was the most stolen car in the year to March 2023, with more than two out of every 100 reported stolen.”
Their analysis highlights a surge of almost half (47%) in the Range Rover theft rate between 2021-22, with around six out of every 10 of the most stolen car models in the UK for Q1 2023 attributed to Range Rovers.
However, according to Adrian Mardell, Chief Executive Officer at Jaguar Land Rover (JLR), these figures are incorrect. He claims that Range Rover thefts fell by more than a quarter (27%) in 2023 compared to 2022 and that newer models were especially secure, with only 11 out of 12,800 having been stolen, according to police data. This equates to roughly 0.08% of those Range Rovers launched in 2021.

In direct response to a historic surge in thefts, JLR installed numerous security features. This has resulted in a drop of more than two-fifths (40%) in the number of Range Rovers stolen in the UK.
The company has also invested £10 million since September 2022 in security updates for 65,000 Range Rover and Range Rover Sport vehicles made between 2018-22, particularly those aimed at preventing keyless thefts.
It has also spent £15 million updating older vehicles with new security software, such as those designed to stop thieves from cloning remote car keys and increasing police funding for analysts.

Why are Range Rovers so easy to steal?
Electric vehicle theft rate statistics
Car crime statistics from the DVLA suggest that Kia is the UK’s most stolen electric car brand. With 290 reported cases in 2023, this equated to just under a third (31%) of all recorded stolen EVs for the year.
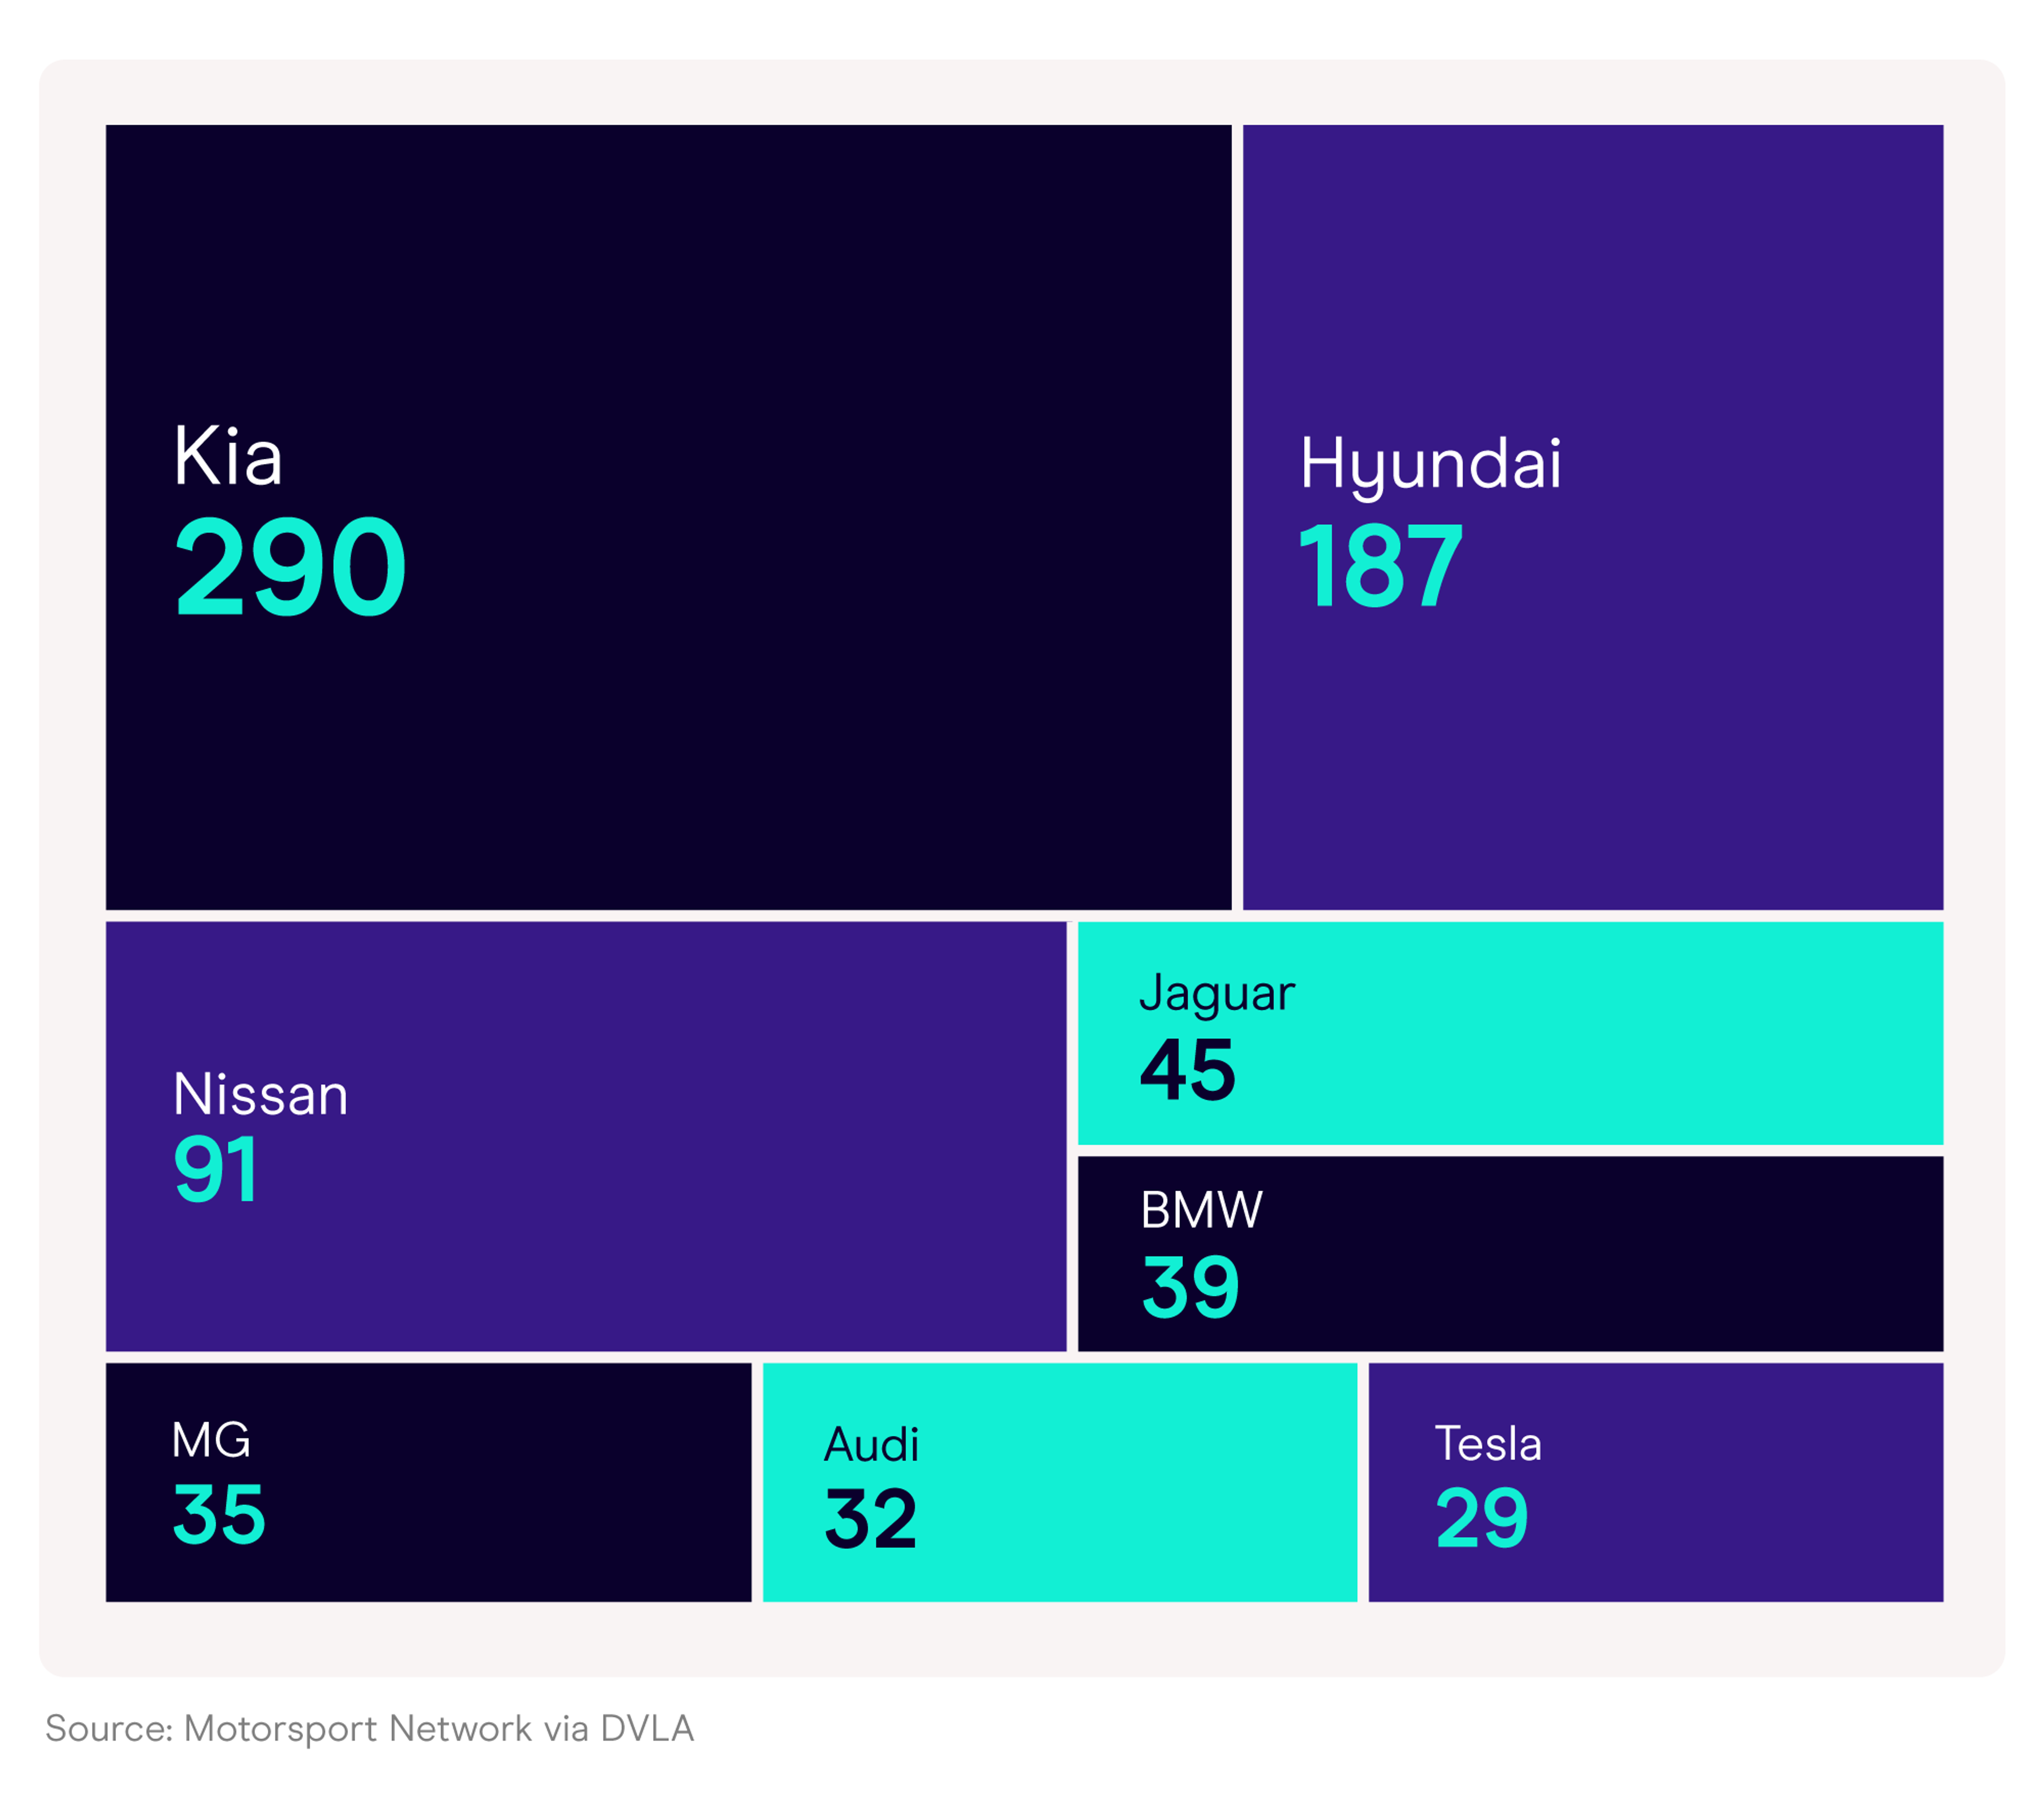
^Most stolen electric cars in the UK (2023)
The second most commonly stolen EV in the UK for 2023 was a Hyundai, accounting for around a fifth (20%) of all reported EV thefts for the year. This represented almost double the number of Nissan EVs stolen that year (91).
Incidentally, despite popular new releases such as the Model Y and Model 3, Tesla’s theft rate remained relatively low compared to other EVs at 29 throughout 2023. This was around 10 times less than Kia in first place.
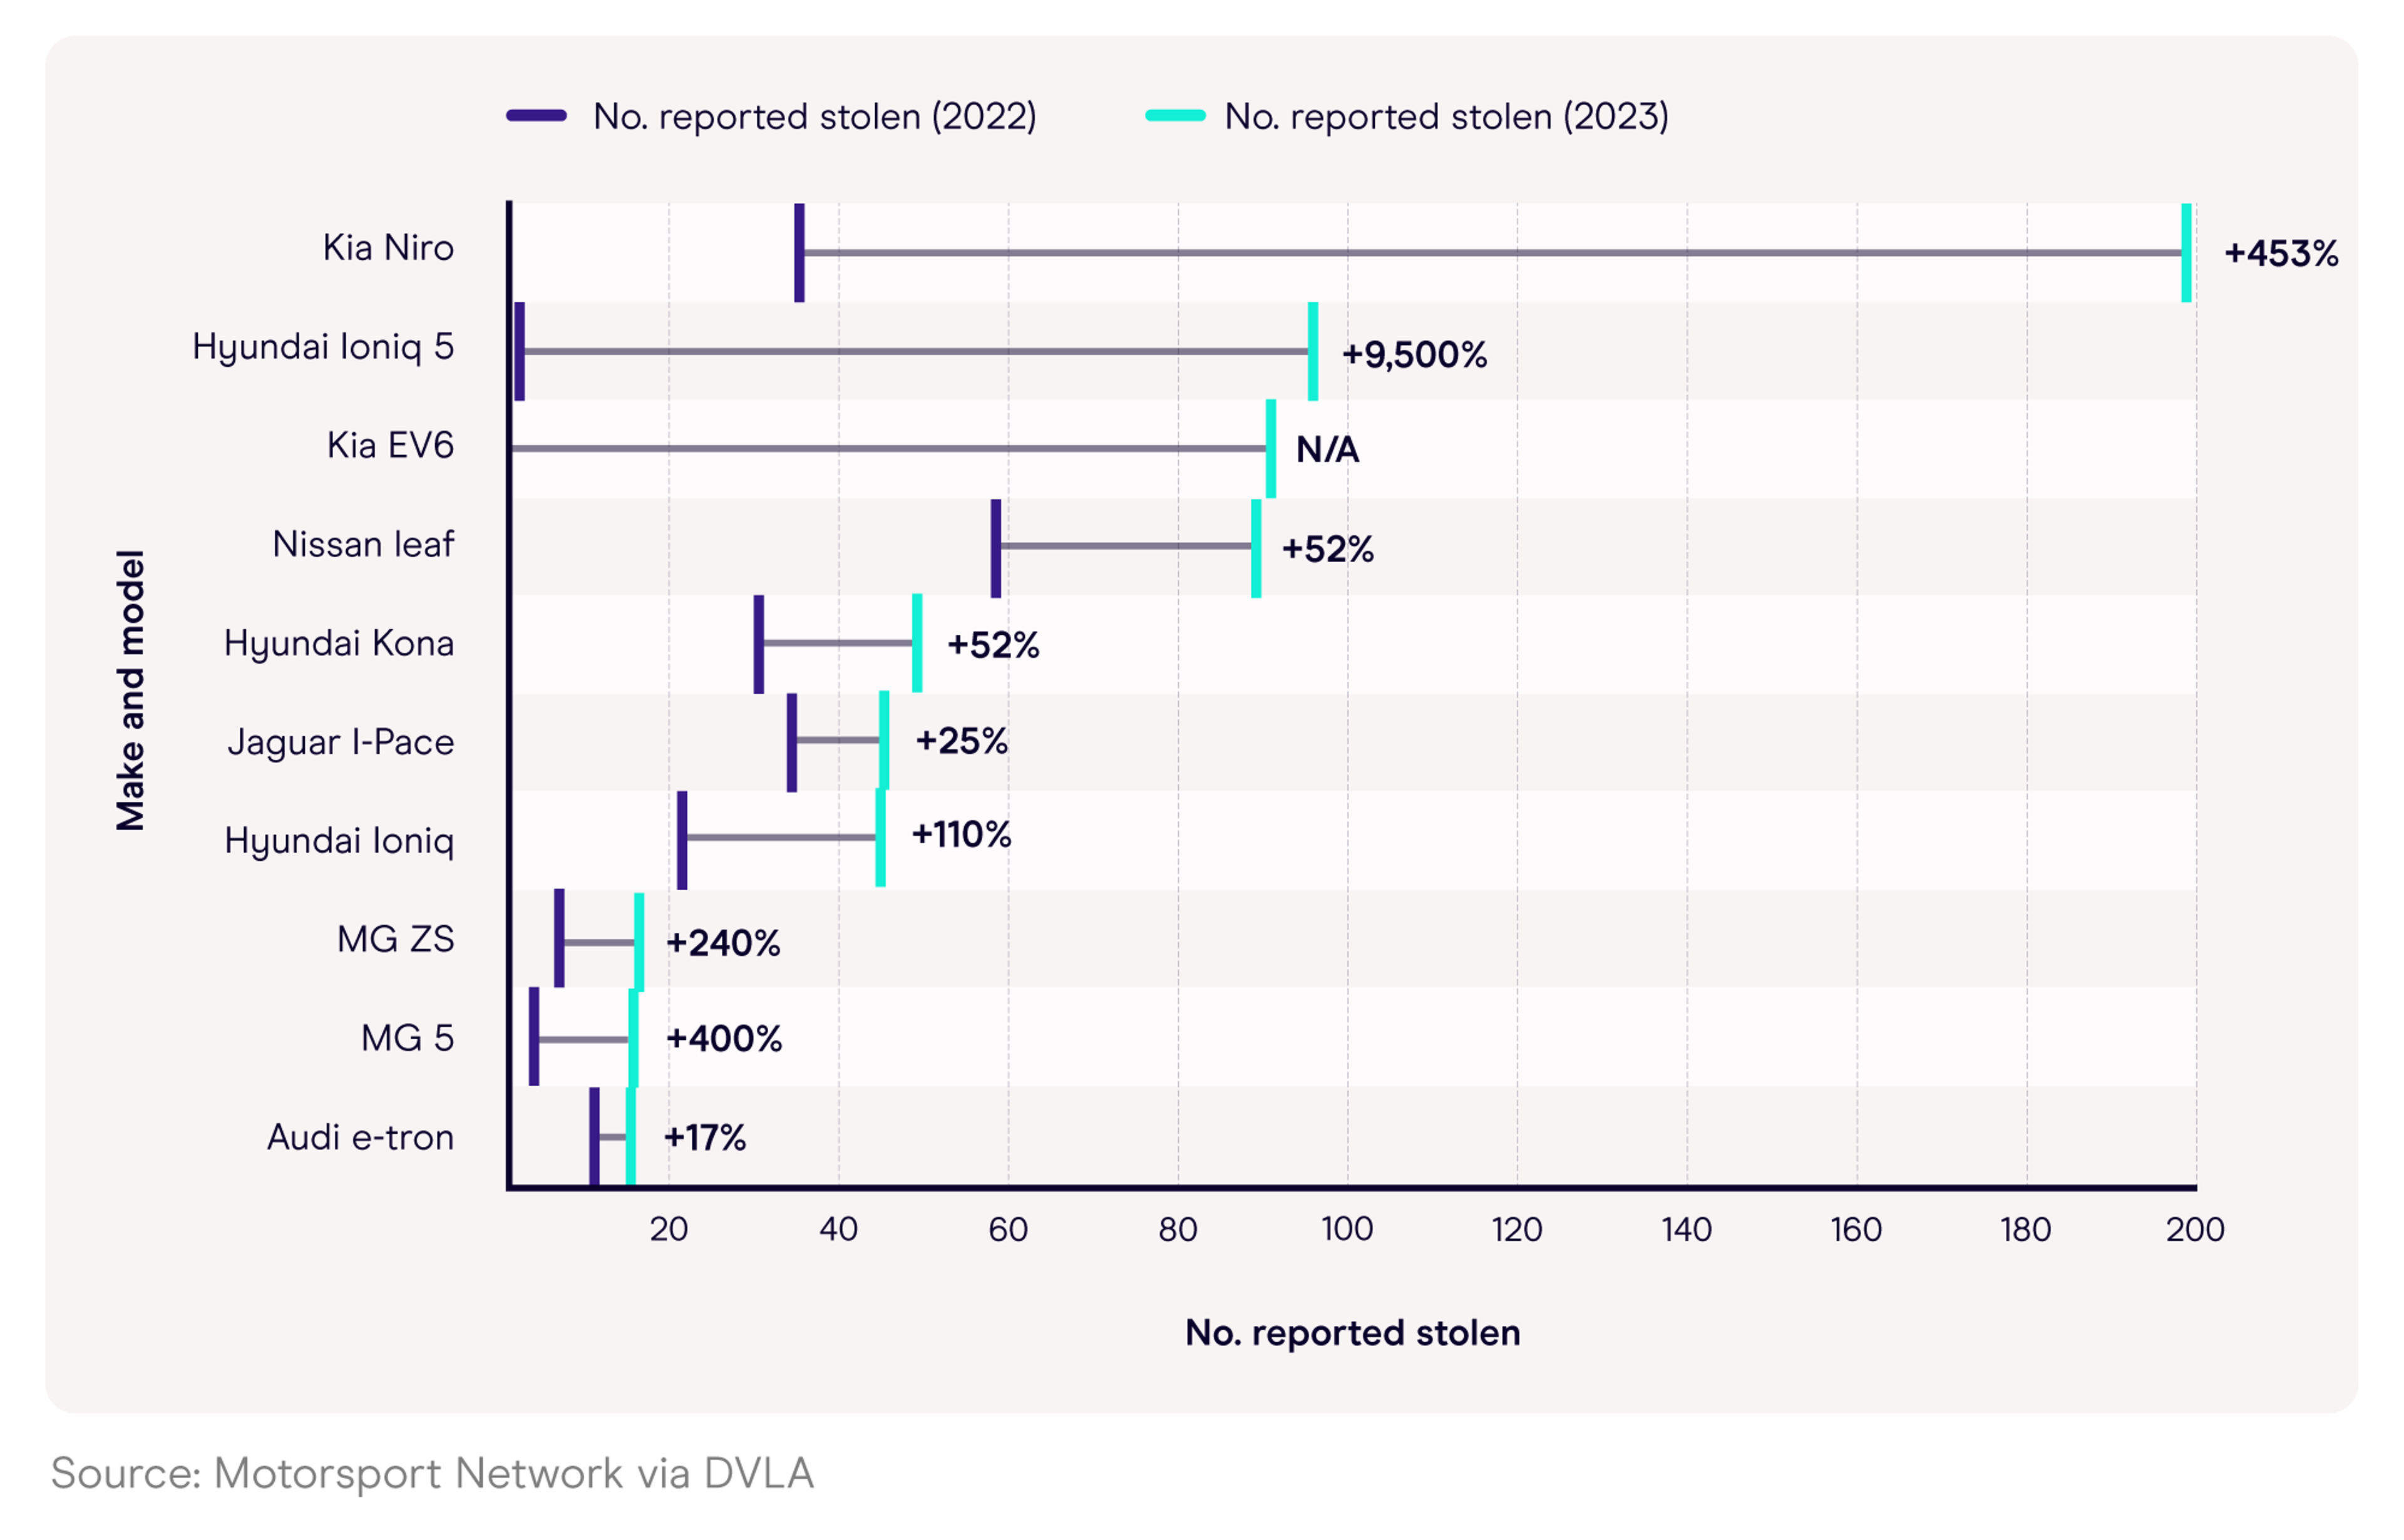
^Most stolen electric car brands in the UK
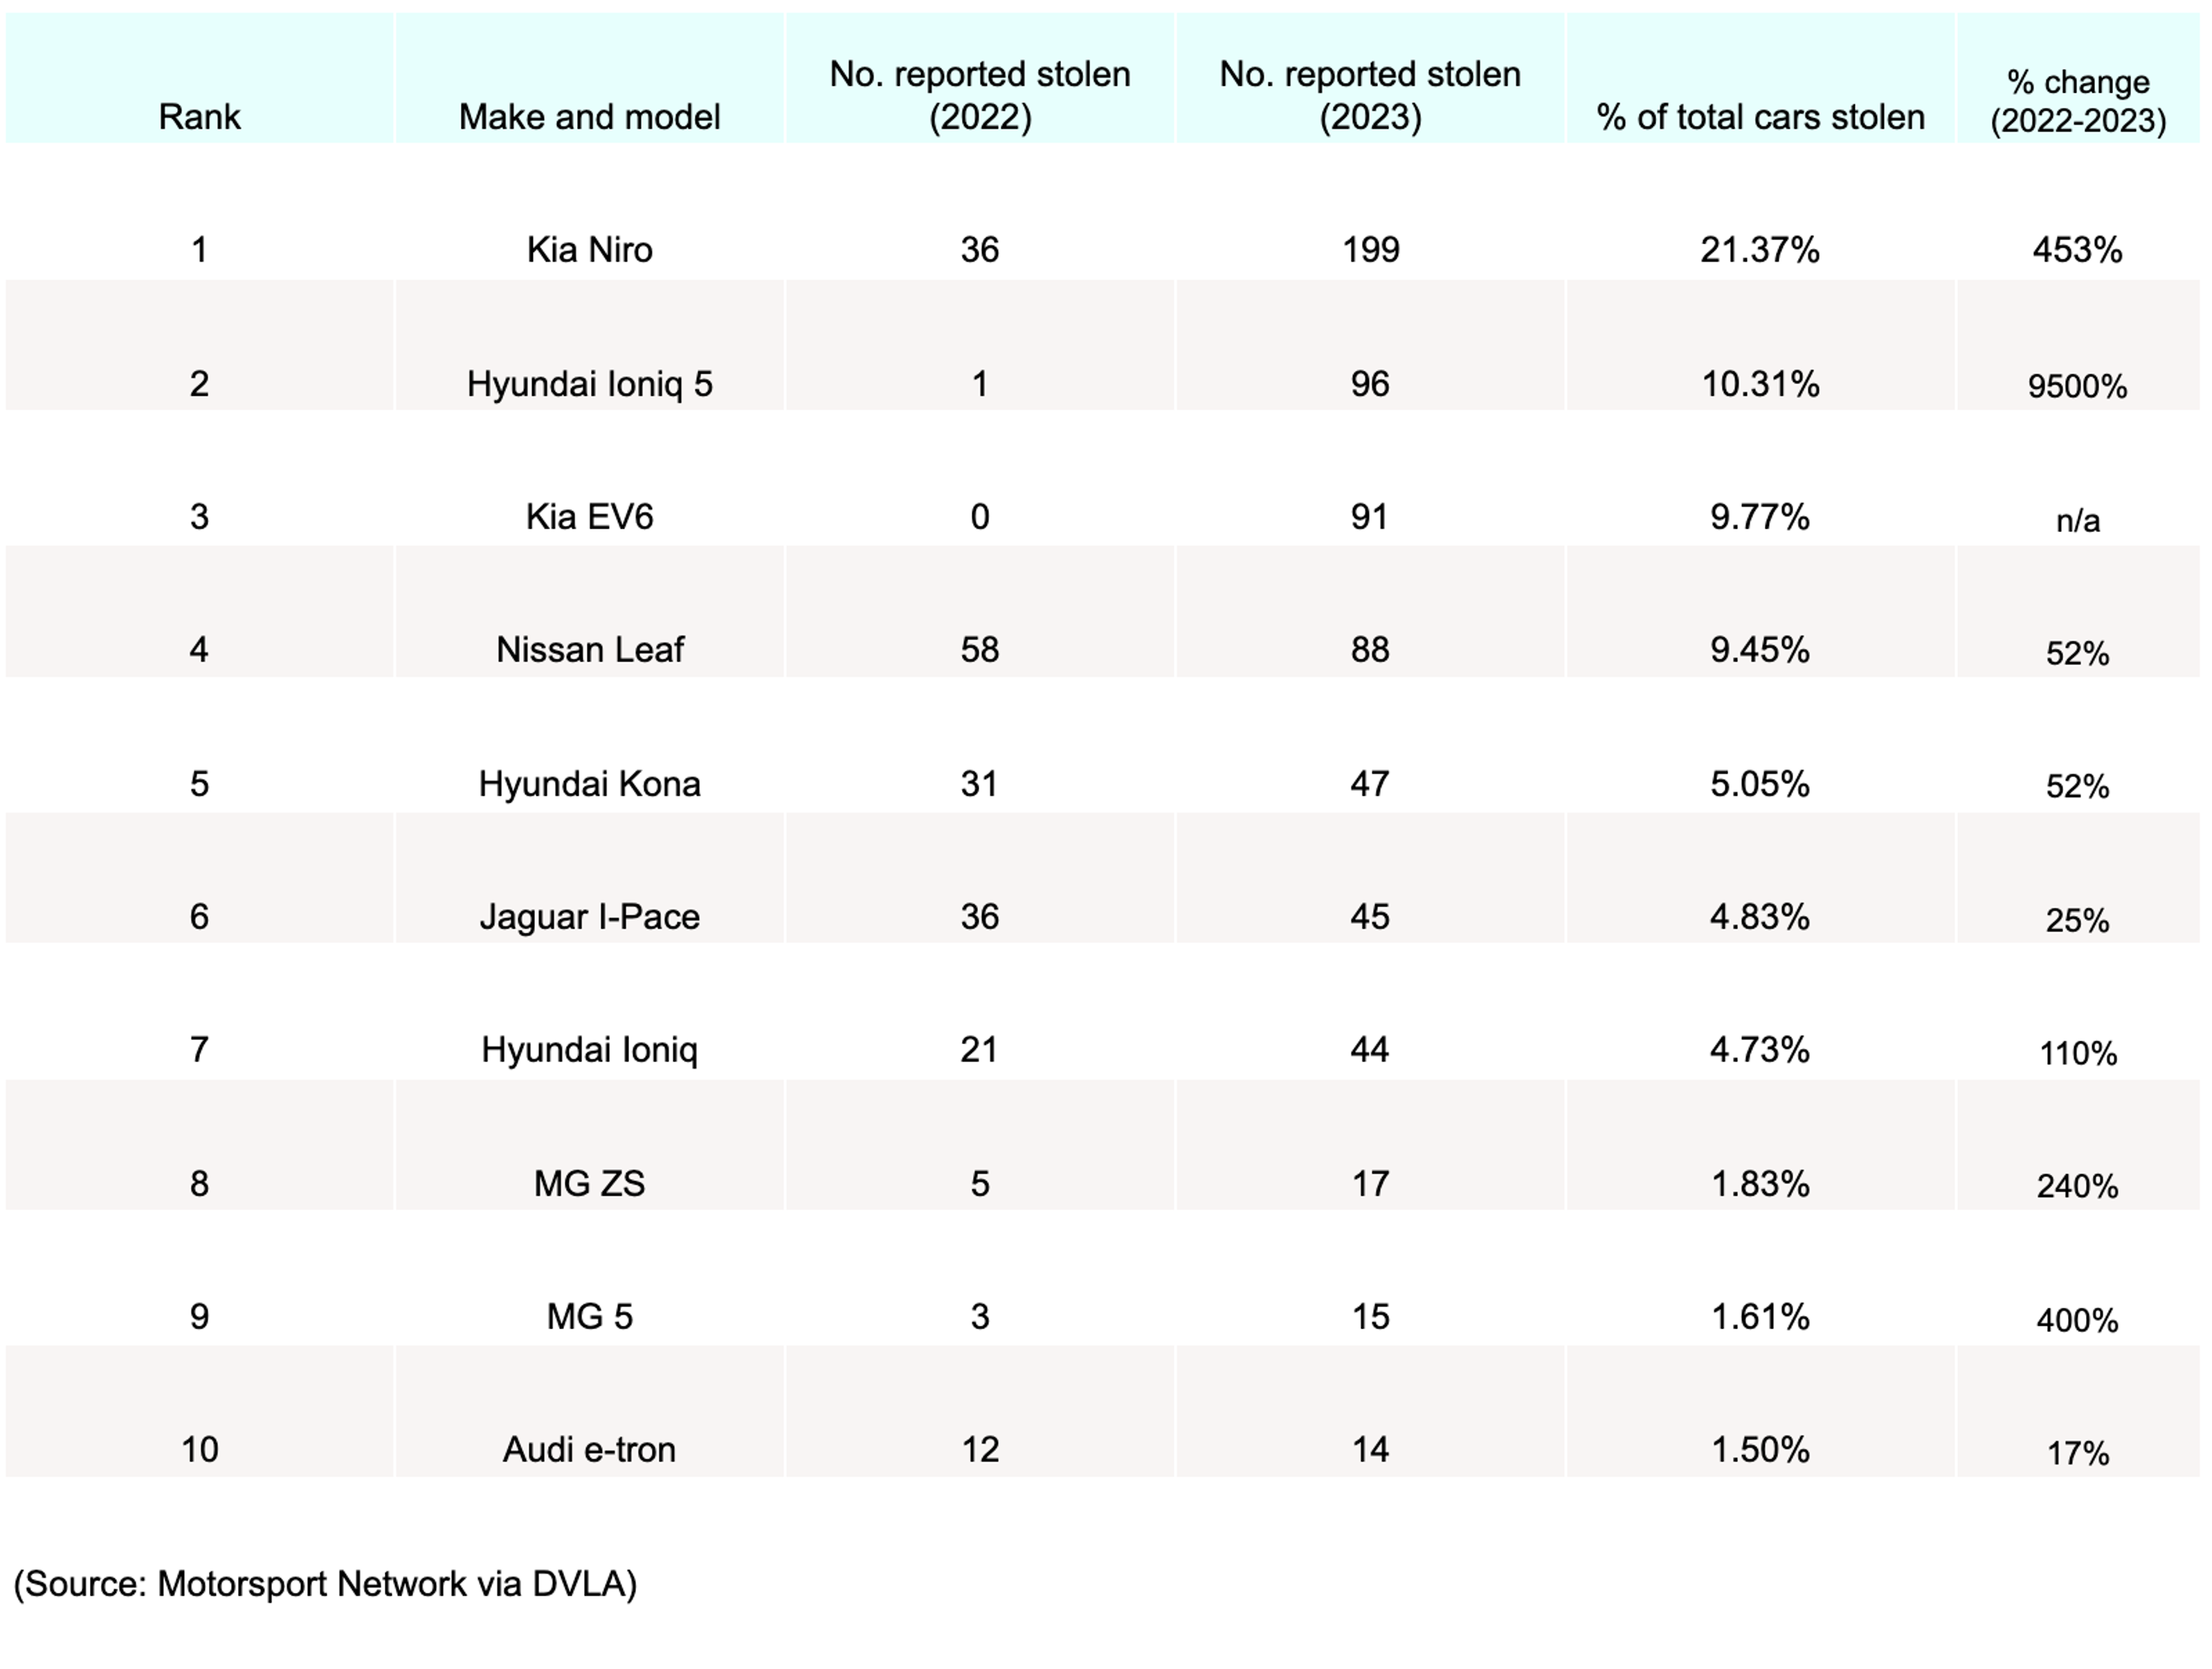
The Kia Niro is the UK’s most stolen EV, with 199 reported thefts to the DVLA in 2023 alone. This represents around a fifth (21.37%) of all EVs stolen for the year and an almost fivefold increase from 2022, when the figure stood at just 36.
In second place is the Hyundai Ioniq 5, with 96 recorded thefts in 2023 – around half the number of thefts compared to the Kia Niro. In all, around one in 10 (10.31%) of all reported EV thefts in 2023 were Hyundai Ioniq 5. This represents a significant rise of 9,500% from the previous year, when just one vehicle was reported stolen.
Even more striking is that by July 2023, just 13 Ioniq 5 thefts were recorded, with the remaining 86% reported stolen in the second half of the year.
Keyless car theft statistics
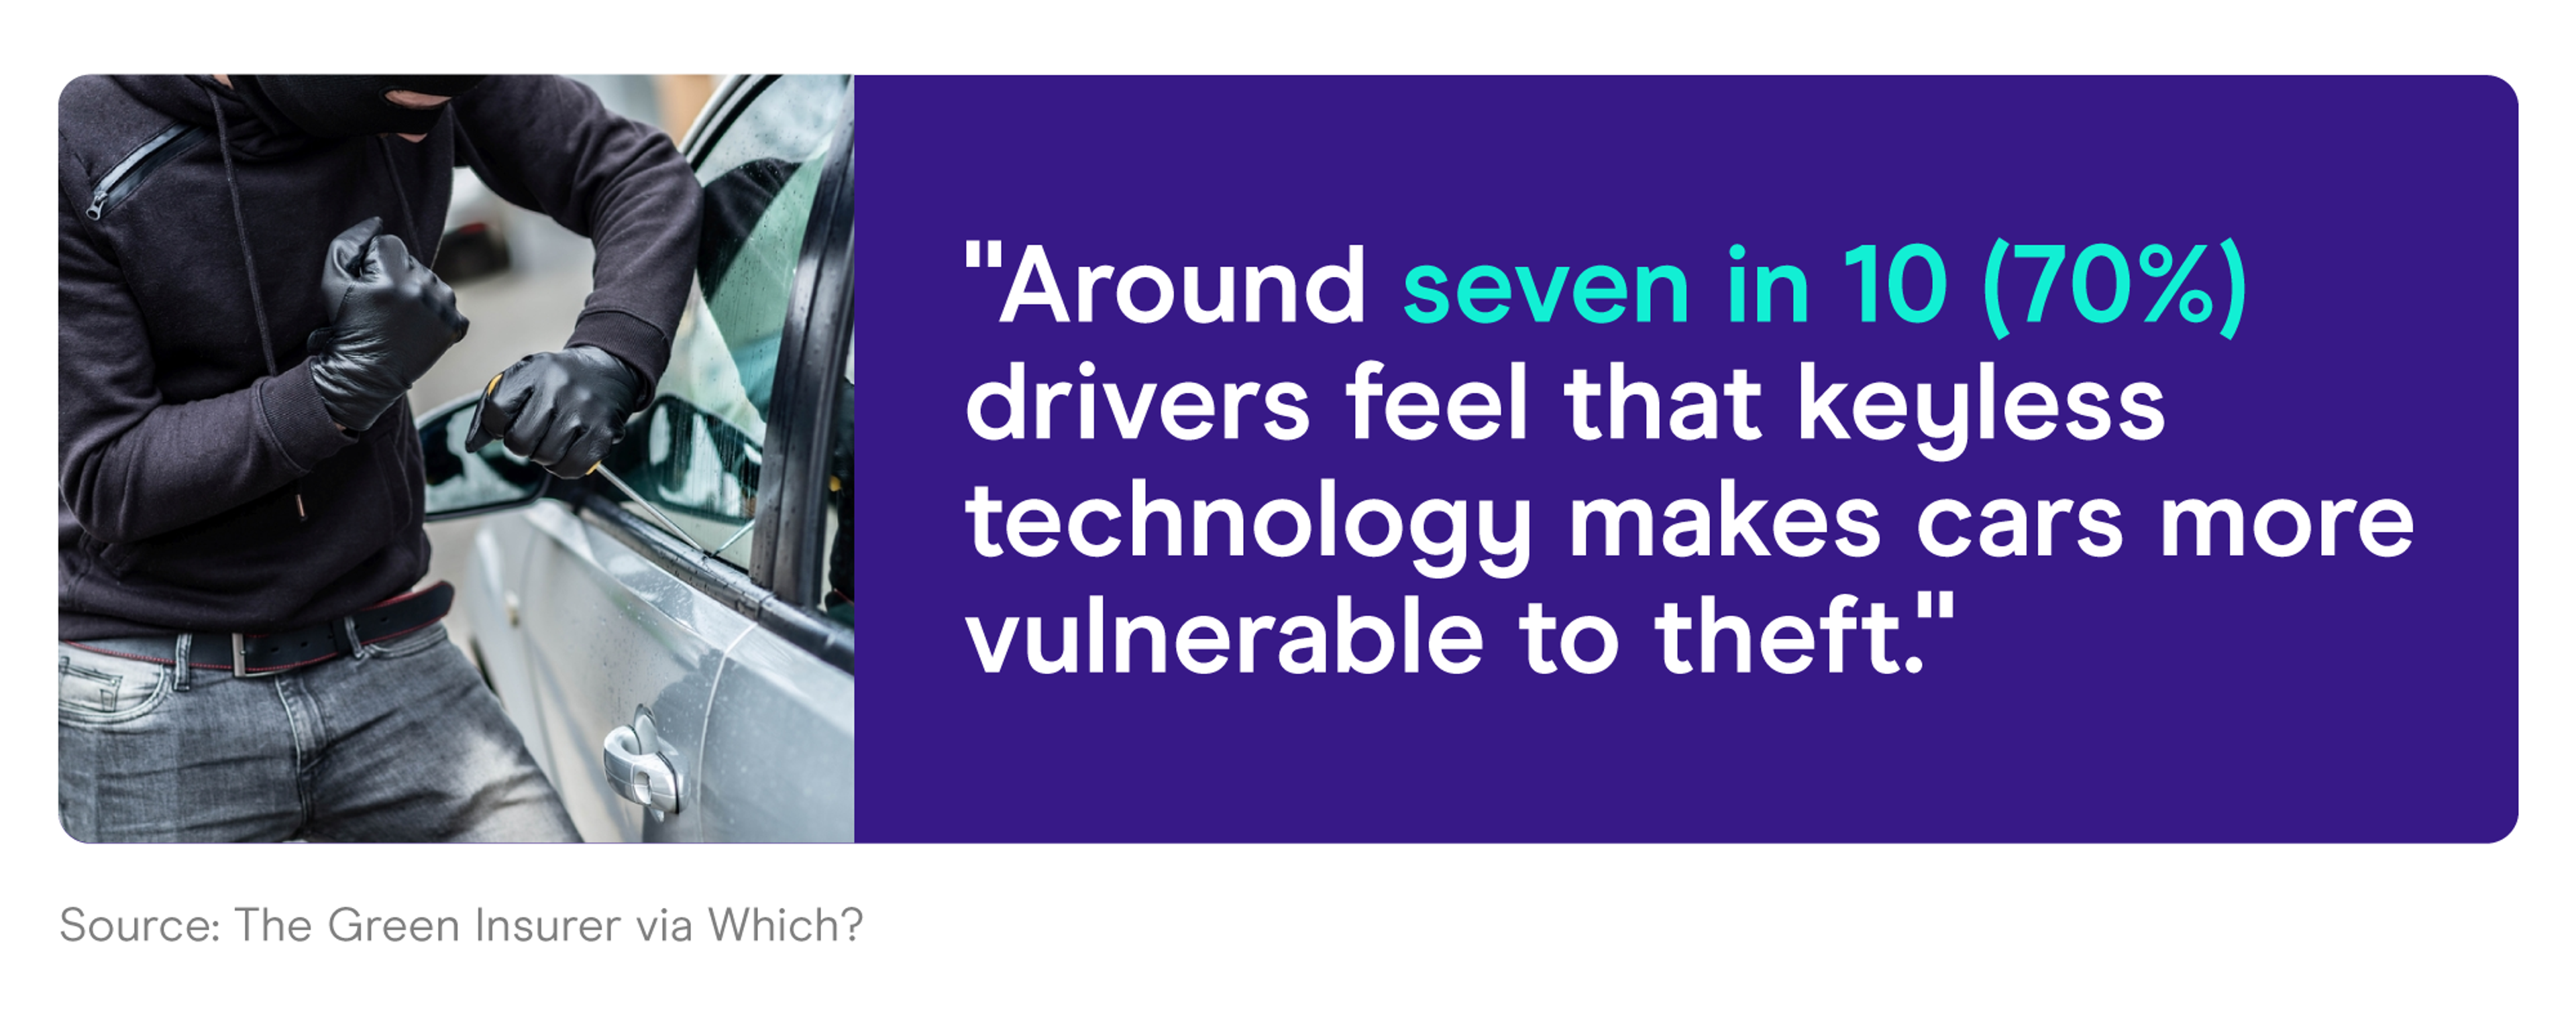
Keyless technology is becoming a popular feature of the modern car, allowing you to access and start your vehicle without having to turn a lock. Instead, a fob you keep on your person sends a signal when you’re close to your vehicle (in theory allowing you safe access).
But, according to a survey by The Green Insurer, around seven in 10 (70%) drivers believe that keyless technology makes cars more vulnerable to theft, which poses some security concerns.
These findings are mirrored by car theft statistics from Admiral, who claim between 60-70% of cars stolen in 2023 were keyless. Aviva also supported this by stating that owners of modern keyless vehicles were twice as likely to make a theft claim on an insurance policy compared to those with traditional key entry systems.
The Green Insurer’s survey also found that four in five (80%) motorists feel car manufacturers need to do more to make their vehicles more secure and difficult to steal.
Which keyless cars are most stolen in the UK?
Keyless car theft statistics from LV suggest that between September 2021 and September 2023, the car brands that saw the largest increase in claims of theft were:
- Lexus (+513%)
- Toyota (+103%)
- Hyundai (+81%)
- Kia (+76%)
According to the insurer, the Lexus RX accounted for more than half (54%) of claims involving a Lexus, with around a fifth (21%) coming from the NX model.
In addition, just under half (47%) of Toyota’s car theft claims were attributed to the RAV4, with the Hyundai Tuscon and Kia Sportage both making up 45% of their respective manufacturer’s claims for stolen vehicles.
UK vehicle theft statistics
Vehicle theft statistics over time
According to the most recent vehicle theft statistics available from the ONS, there were almost 1.6 million vehicles reported stolen in 2023 across England and Wales, representing a rise of 3.9% from the previous year.
Between 2016-18, the number of reported vehicle thefts generally rose year-on-year (Y-o-Y) from just over 1.5 million to around 1.84 million – an increase of more than a fifth (22.7%) in the space of three years.
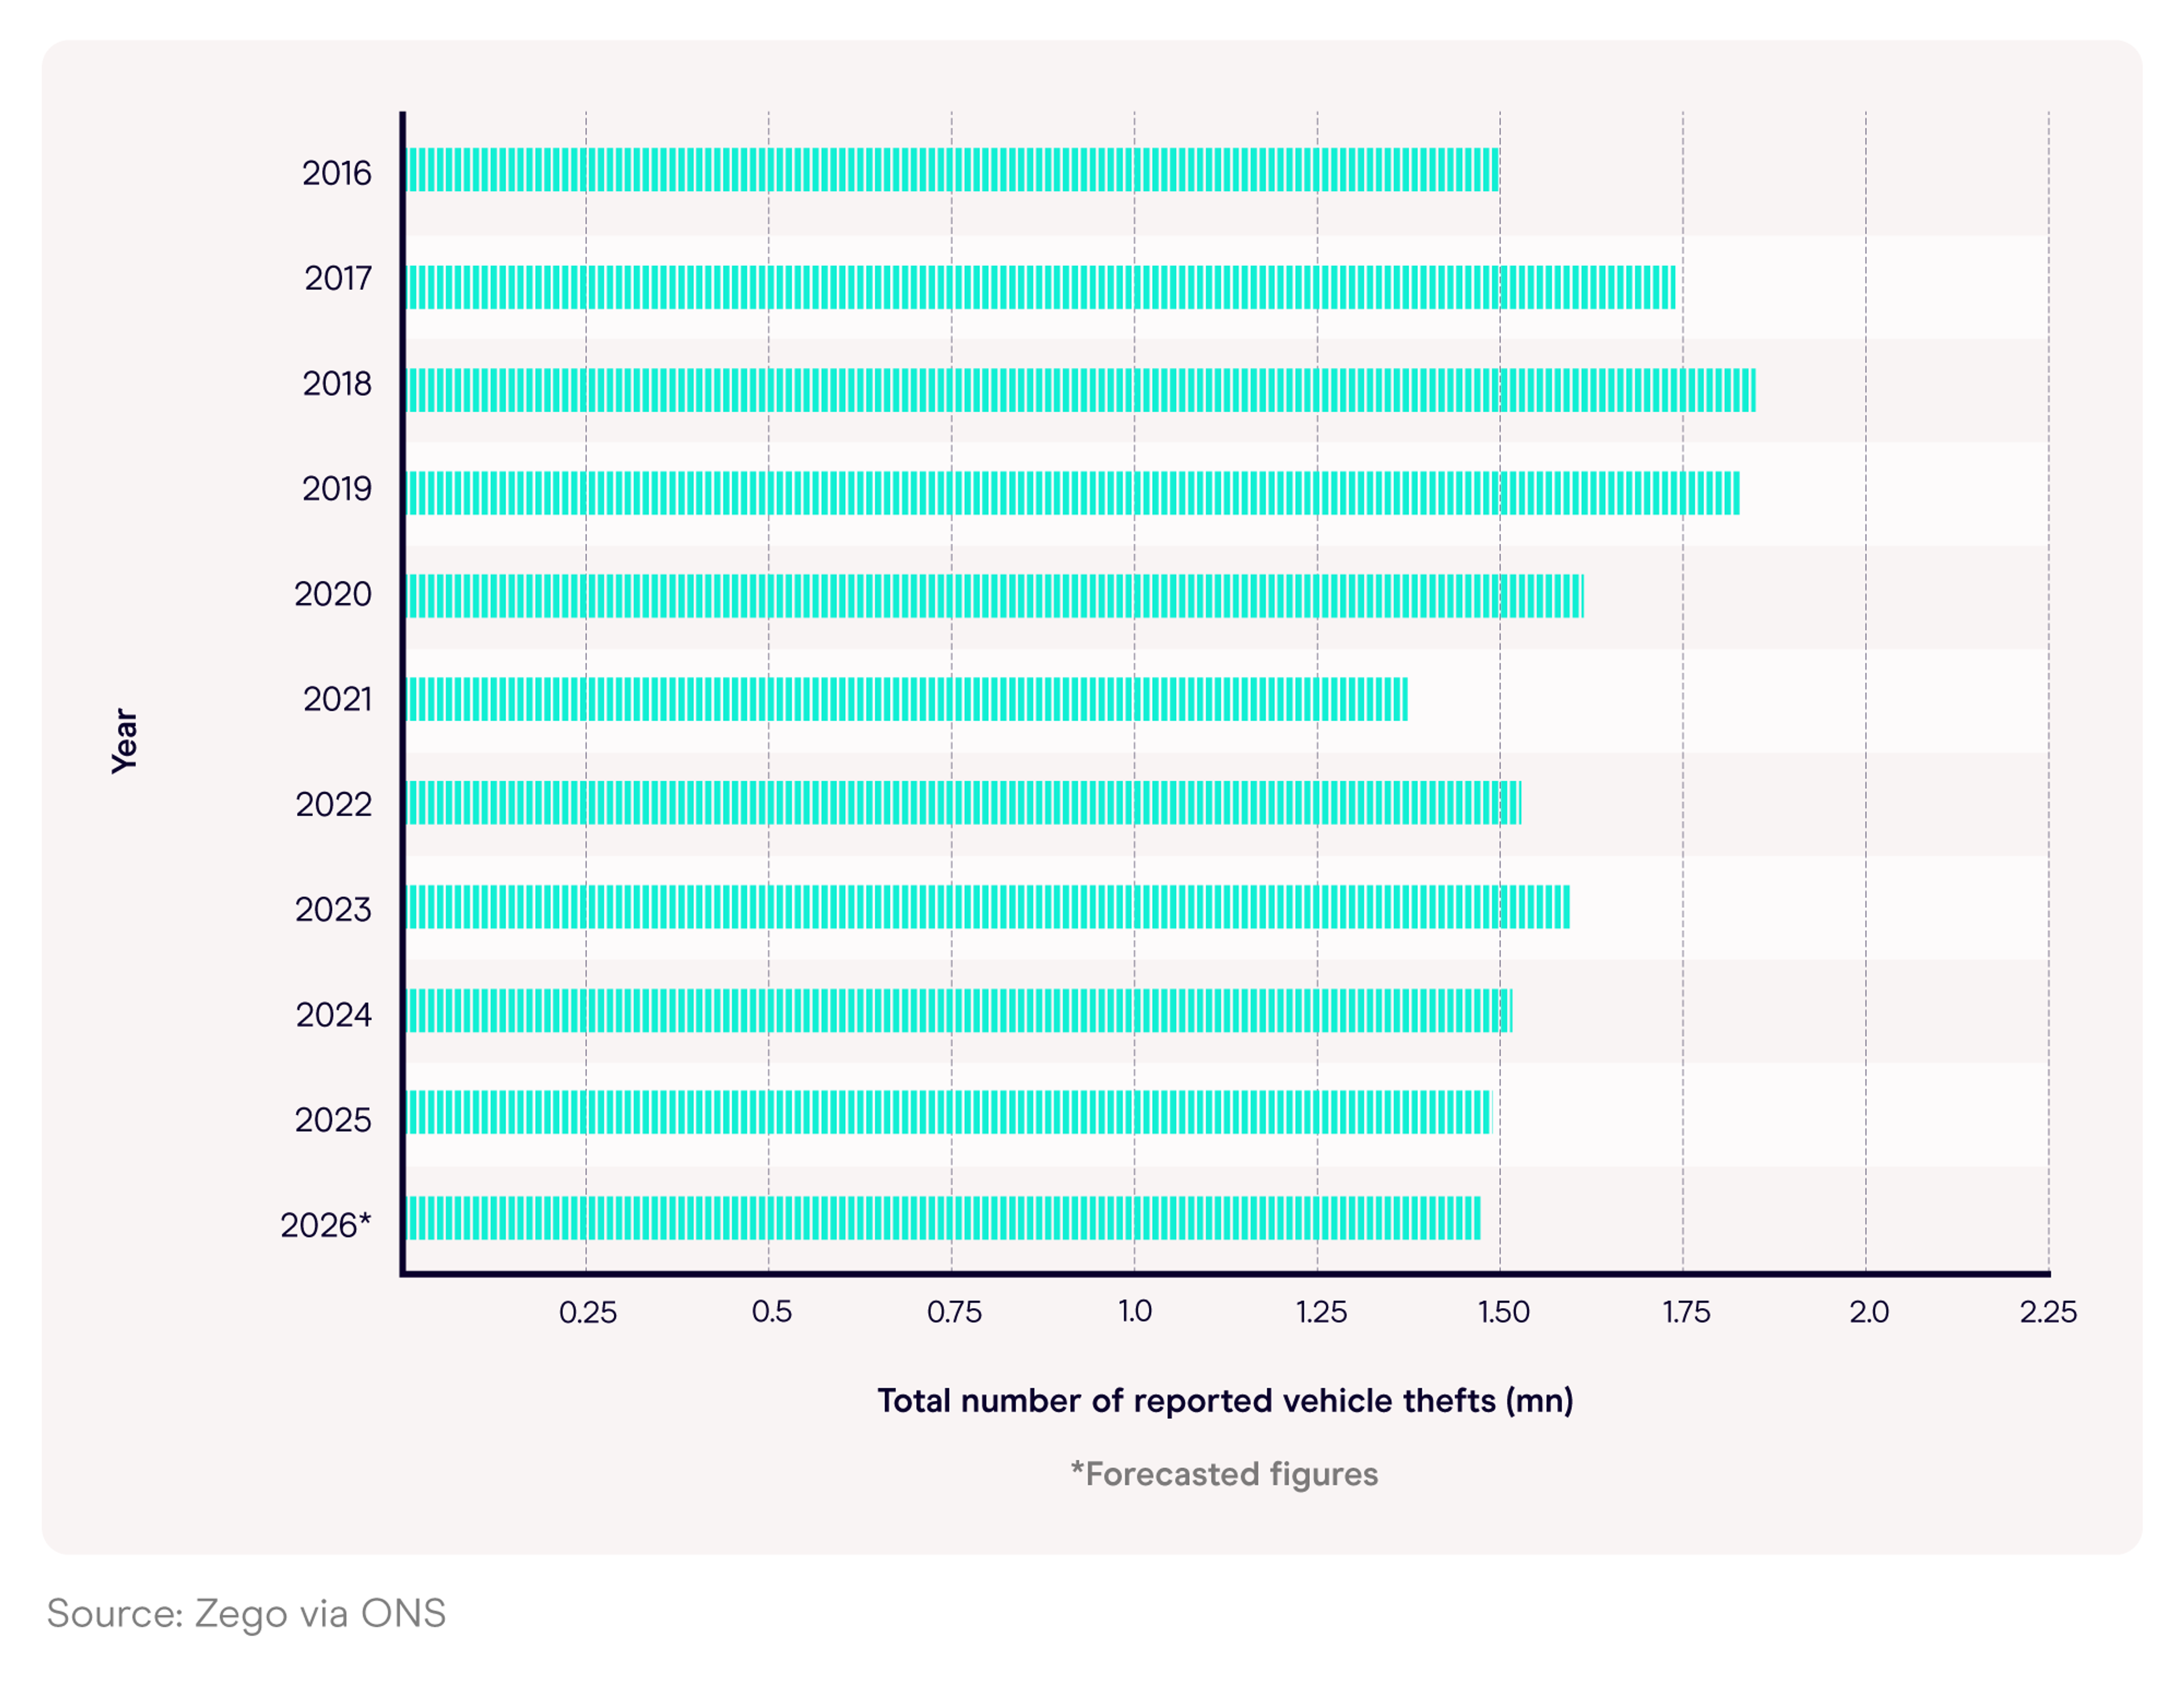
^ Number of reported vehicle thefts each year over time (2016-26)
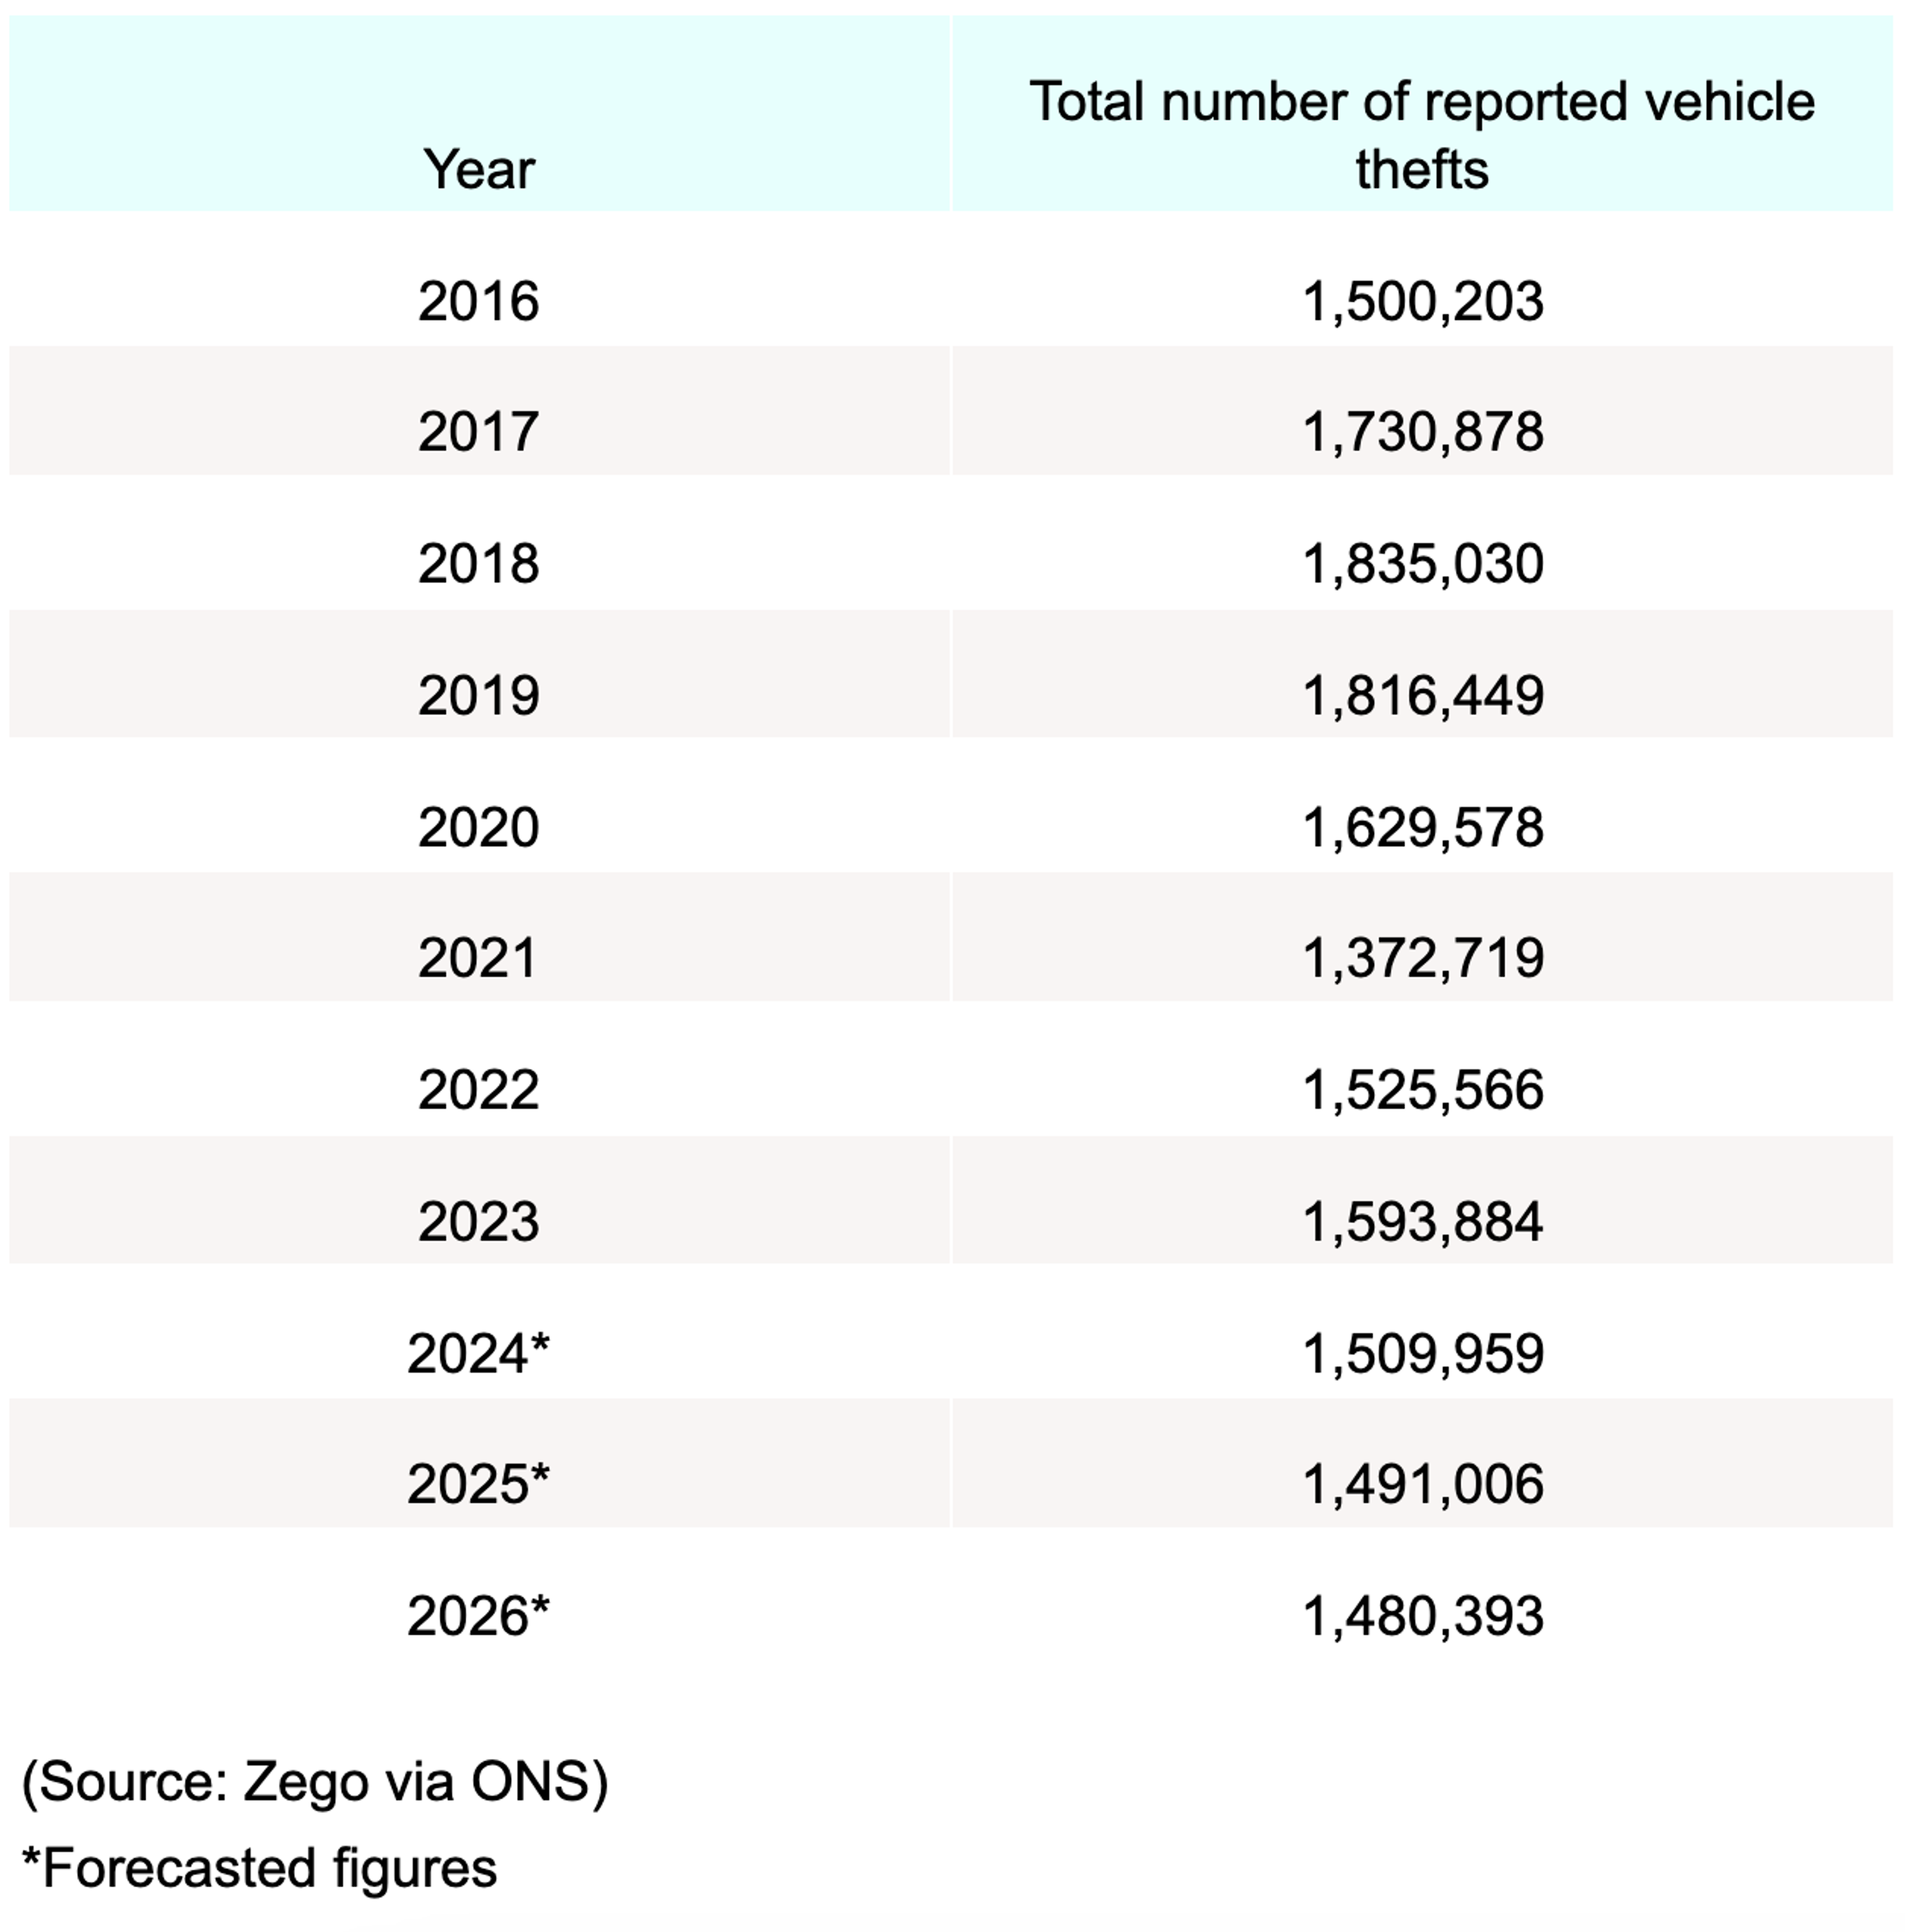
From here, the numbers declined Y-o-Y to around 1.37 million in 2021. This indicated the lowest recorded figure for vehicle thefts between 2016-23 across England and Wales and represented a decrease of more than a quarter (25.5%) between 2018-21.
According to forecasts by Zego, the number of reported vehicle thefts is expected to decrease Y-o-Y from 2024 to 2026, falling by an anticipated 2% during this period.
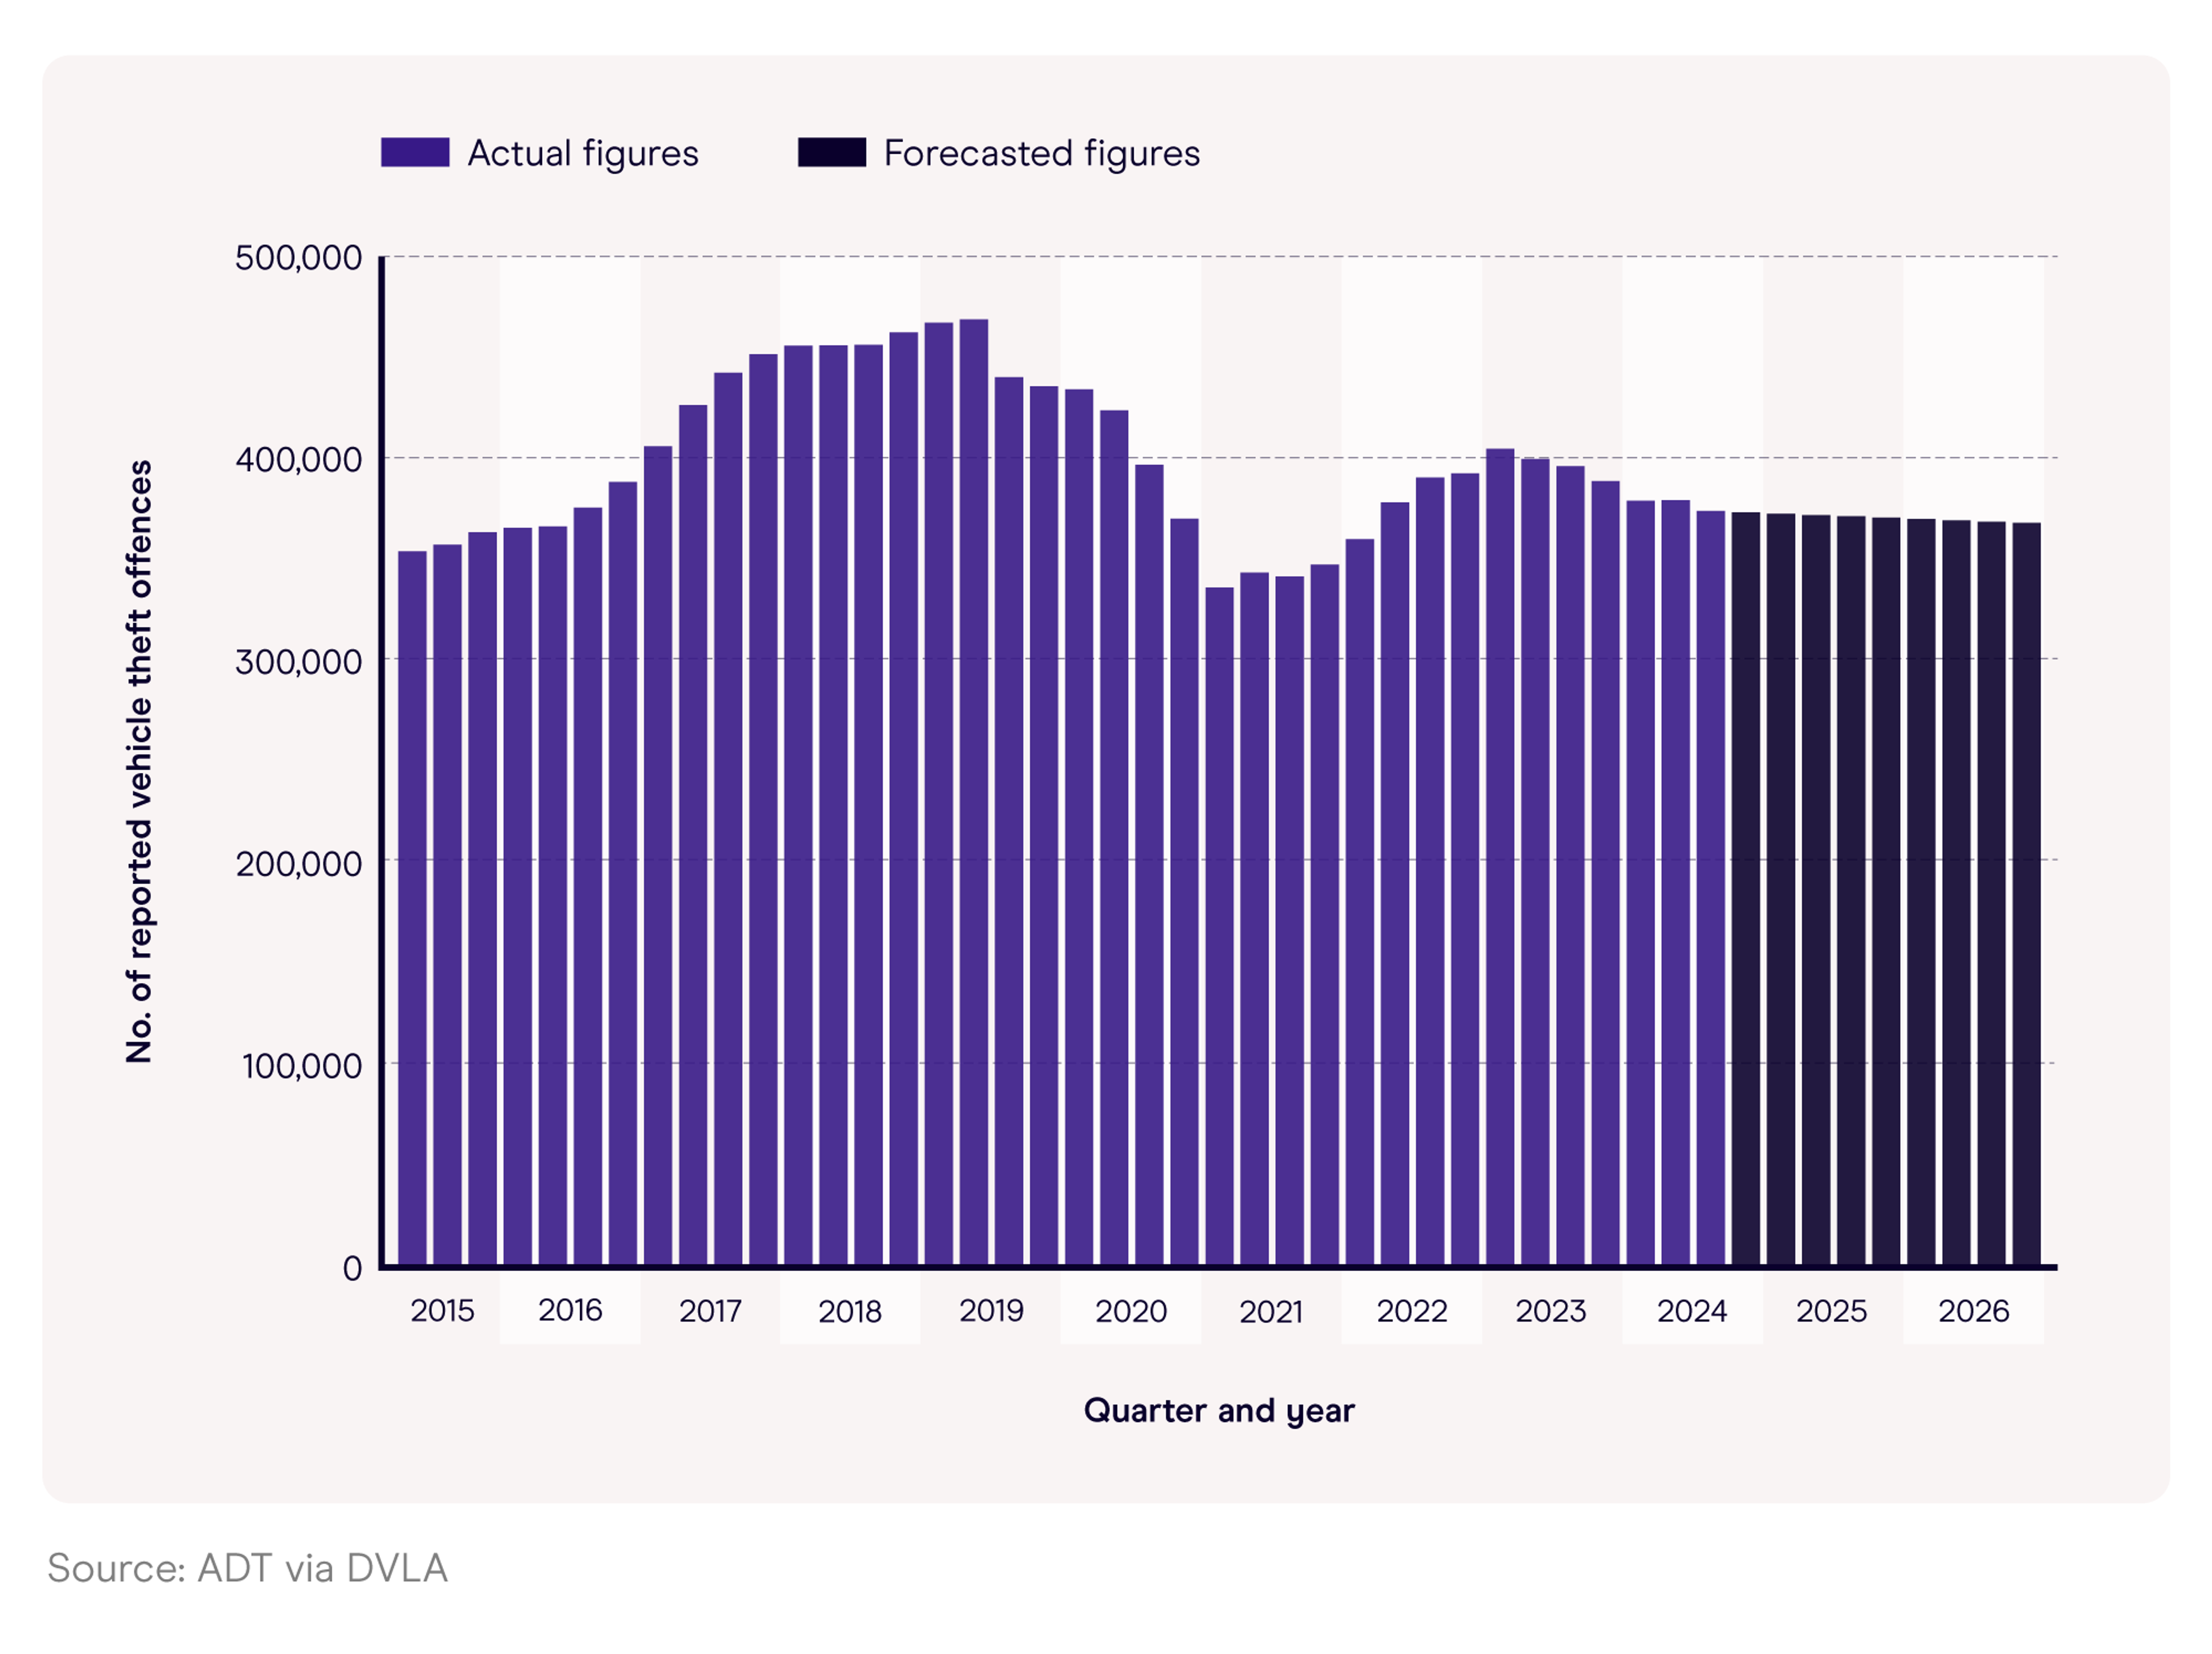
^Number of reported vehicle thefts each quarter over time
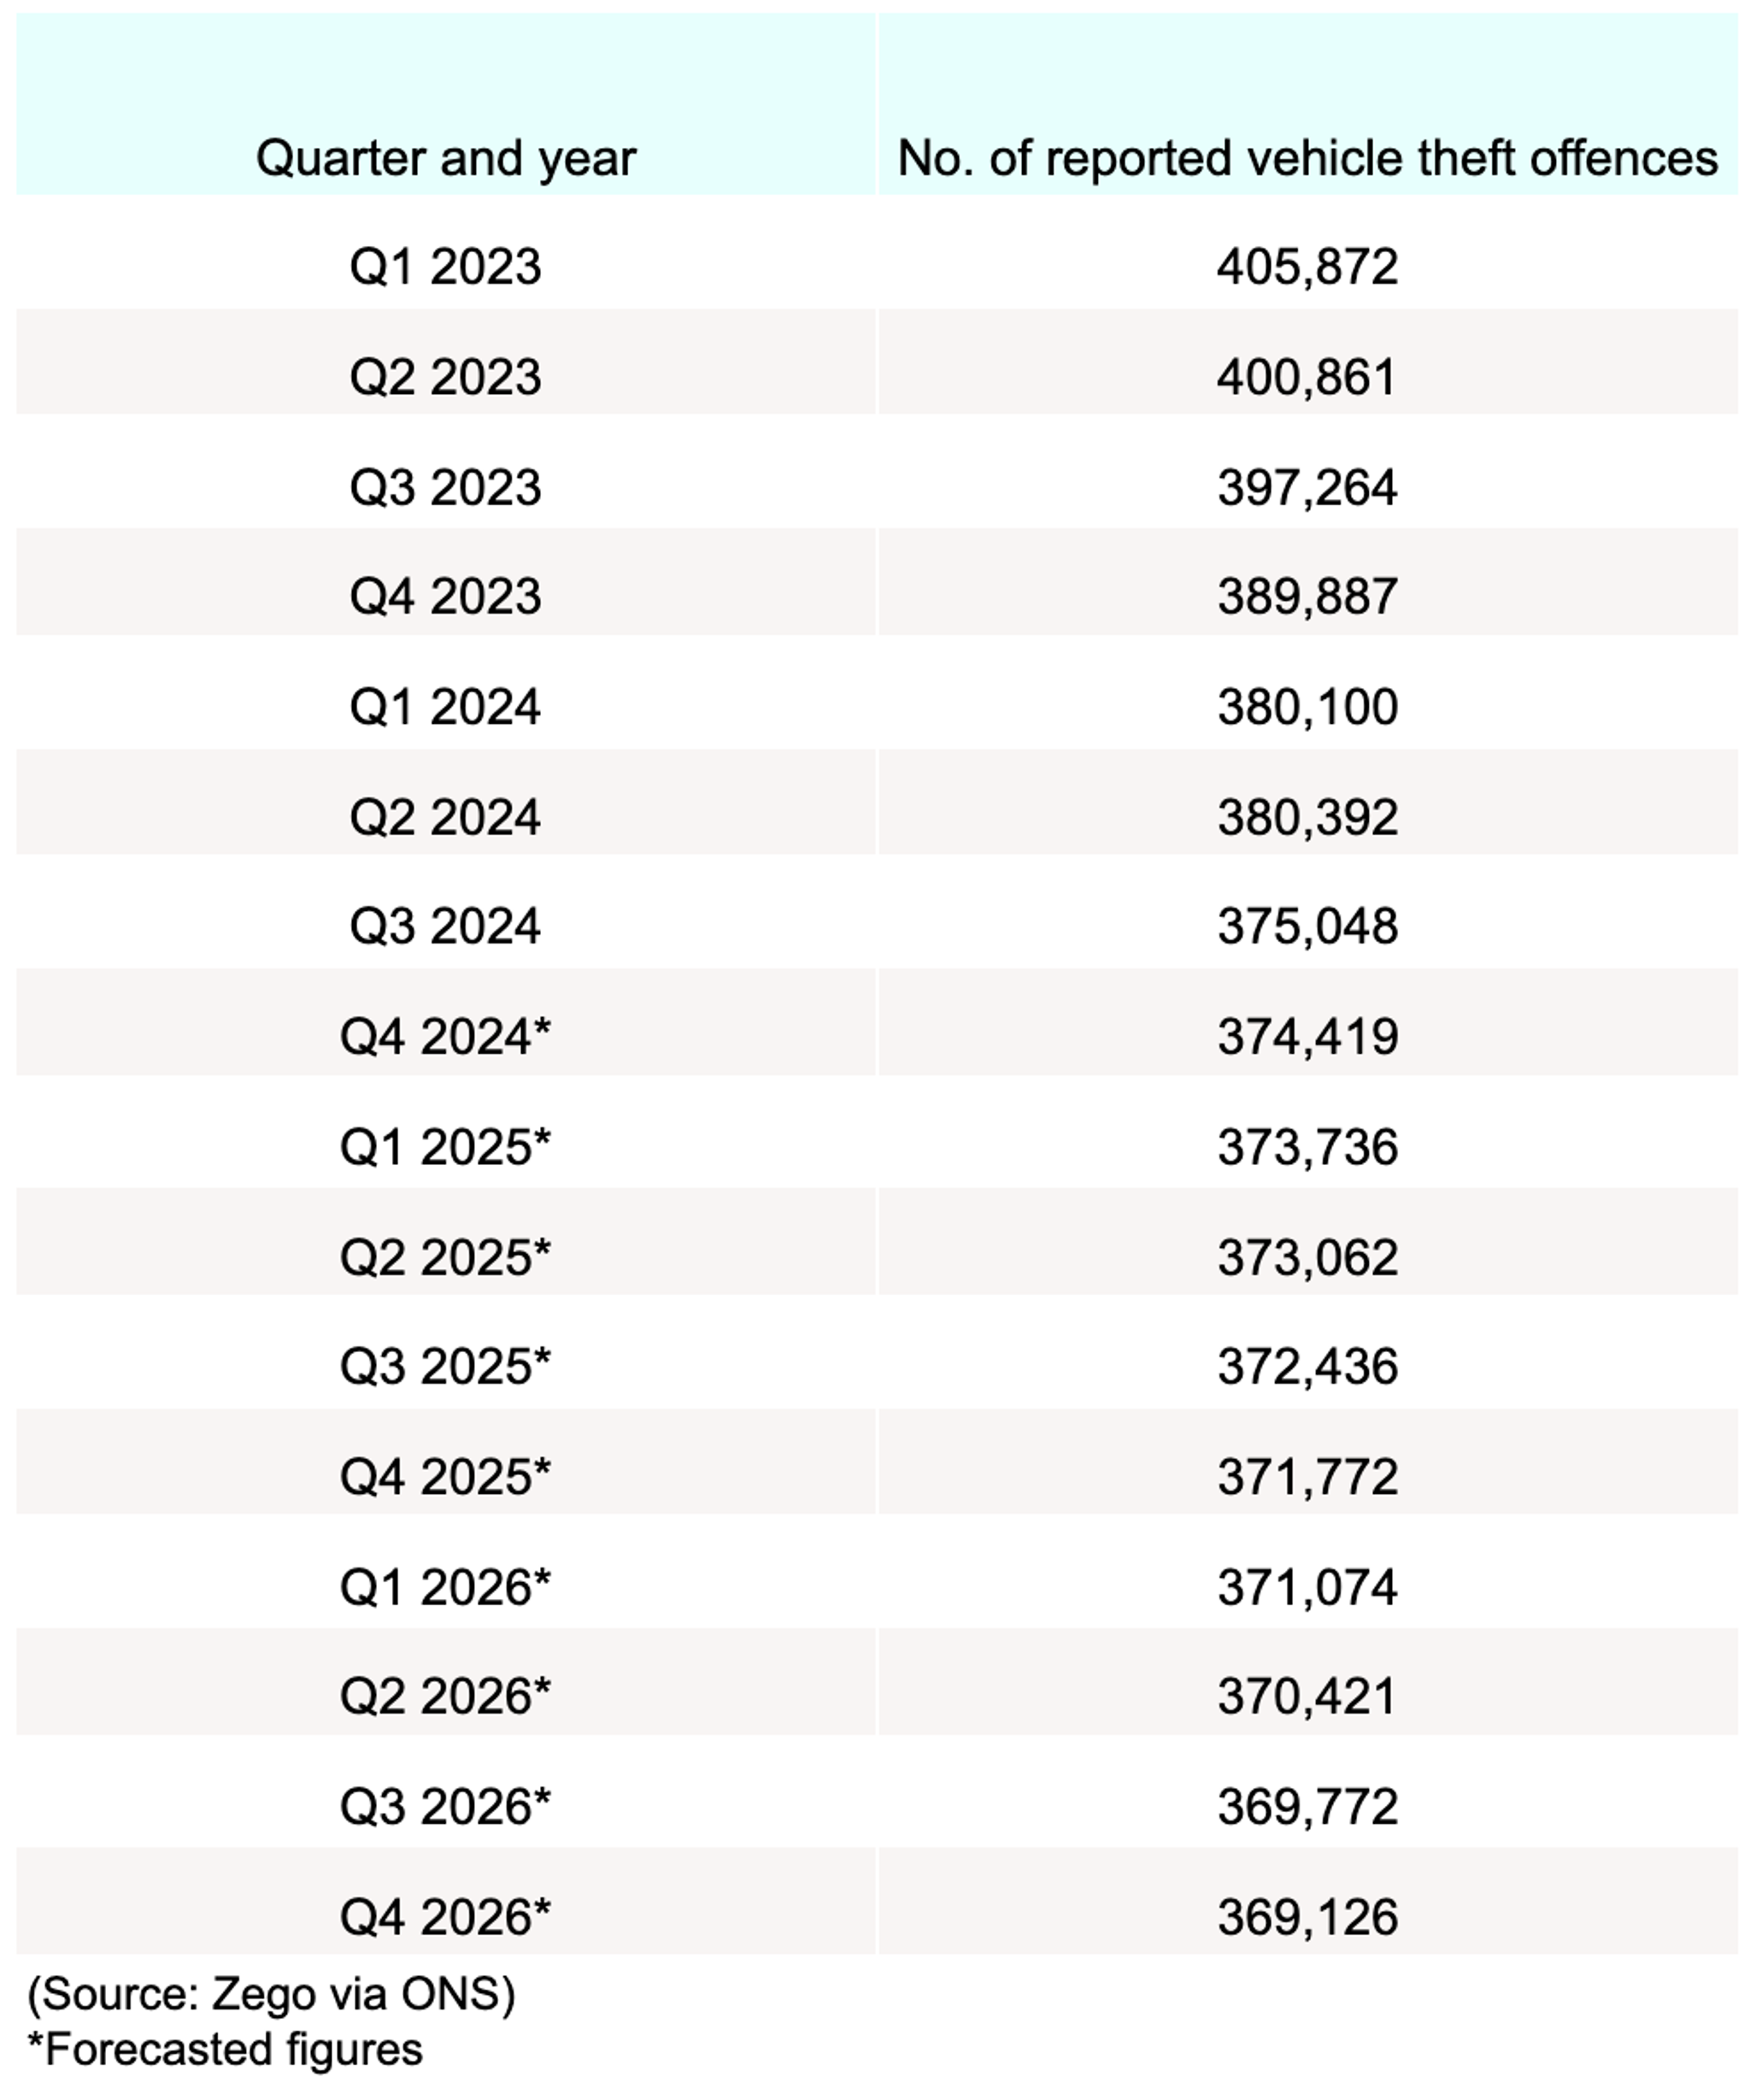
As of Q3 2024, there were just over 375,000 reported vehicle theft offences across England and Wales. This followed a quarter-on-quarter (Q-o-Q) decrease from Q1 2023, when the figure stood at 405,872 – an overall drop of around 7.7% in the space of 21 months.
Vehicle theft in England and Wales had historically been on an upward trend, rising from just over 355,000 cases in Q2 2015 up to a peak of 469,915 in Q2 2019 – an increase of almost a third (32.3%) in the space of four years.
The number of reported vehicle thefts dropped by more than a fifth (22.6%) in the space of 12 months, falling from 435,358 in Q1 2020 to a record low of 337,104 in Q1 2021.
Based on estimates from Zego, this downward trend is anticipated to continue throughout 2025-26 to around 369,126 by the end of 2026 – a drop of 1.4% across the previous two years.
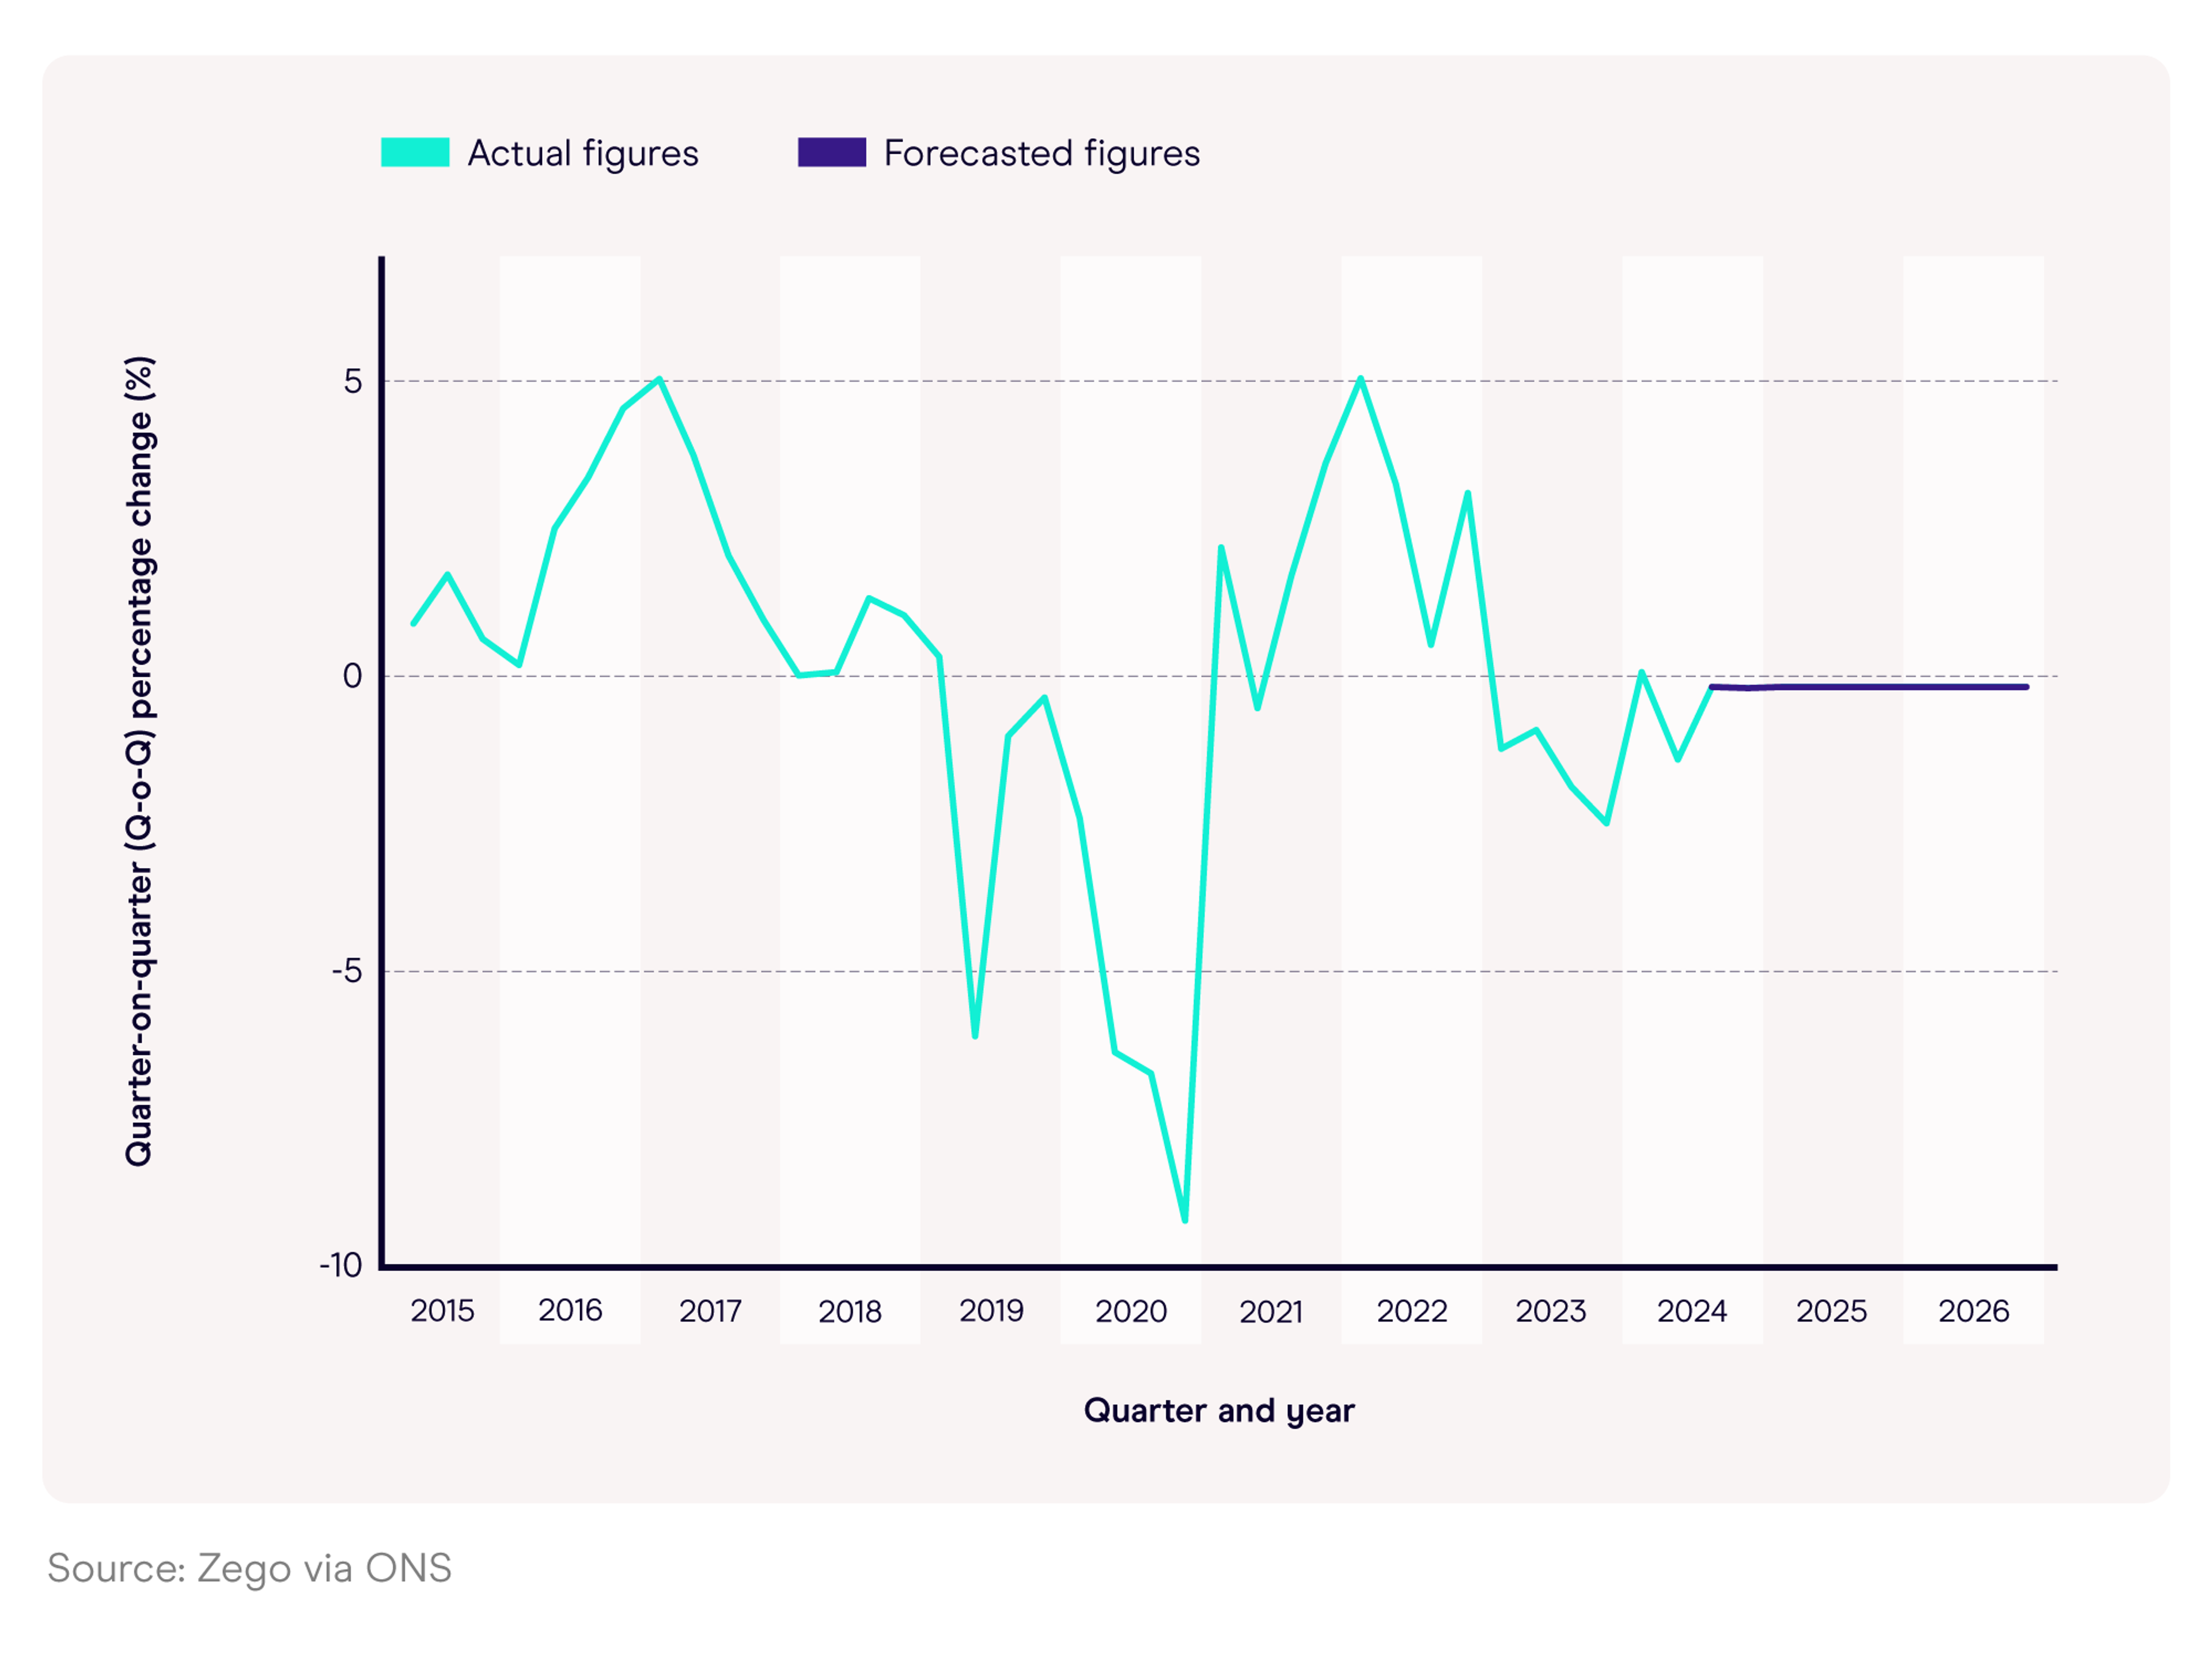
^ Quarterly percentage change in the number of reported vehicle thefts over time
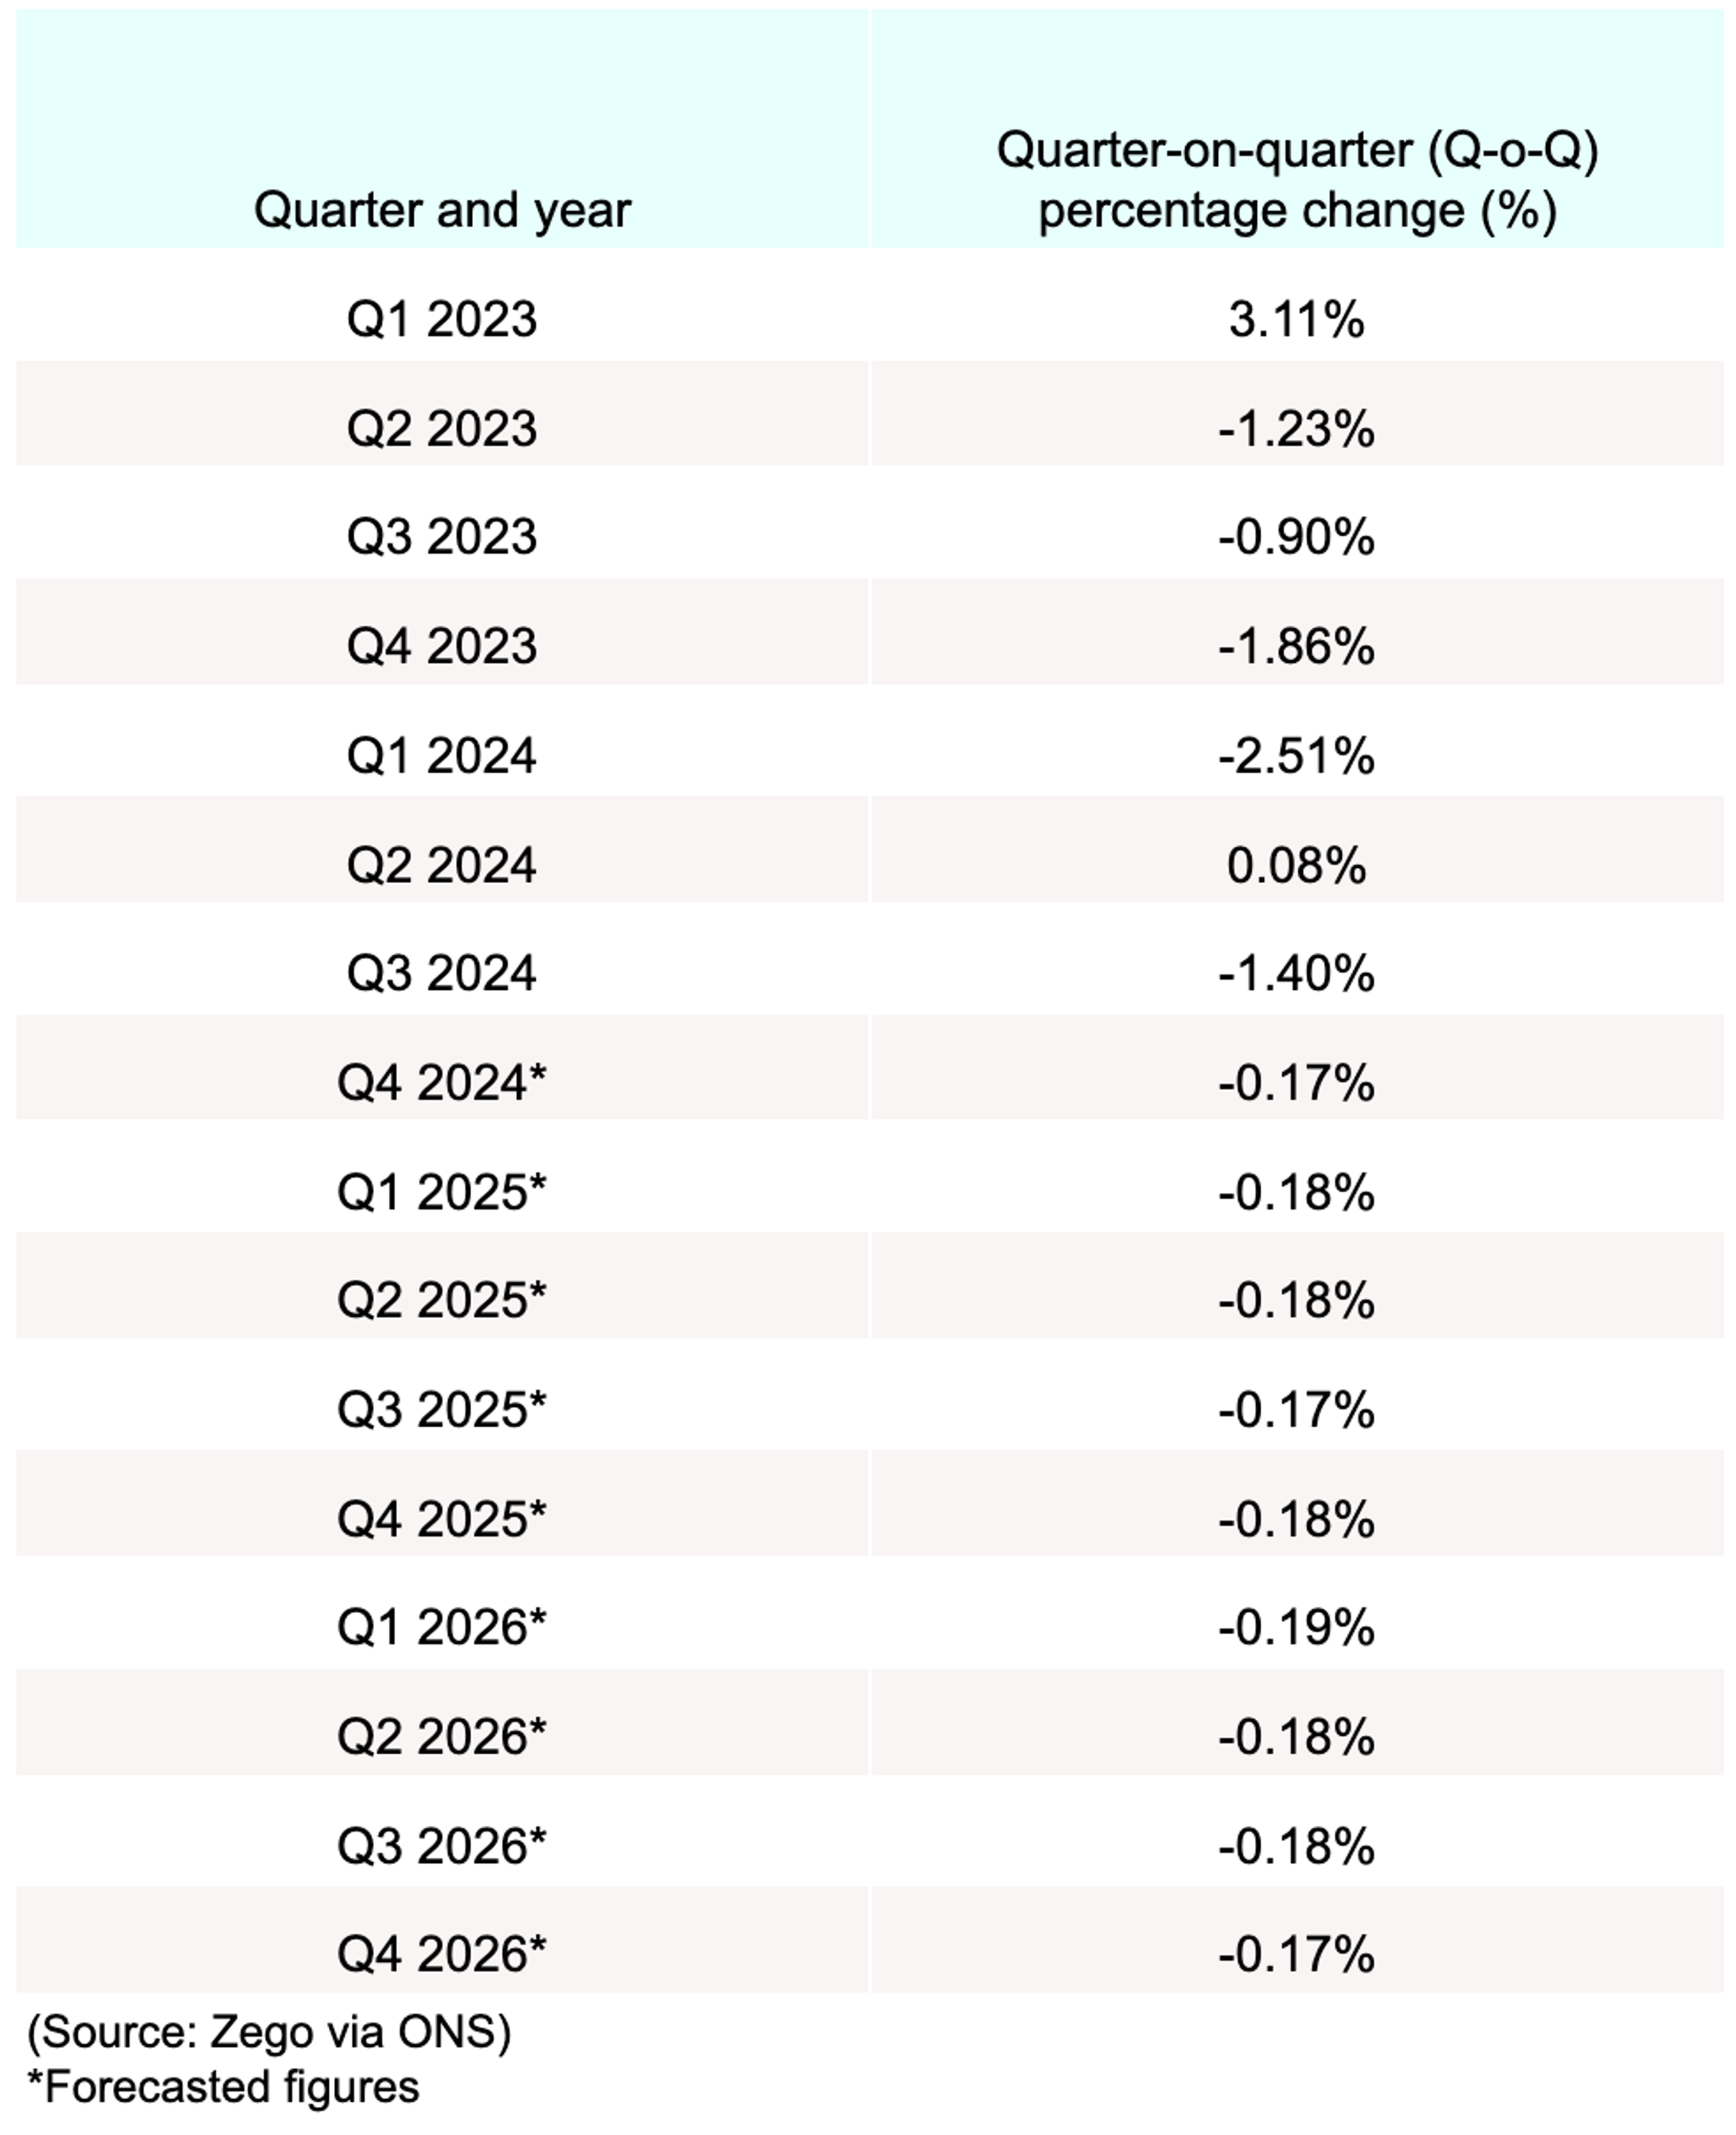
The number of reported vehicle thefts experienced some significant fluctuations between 2015-24 in terms of the quarterly percentage change, reaching a peak of +5.05% in Q2 2022 and a low of -9.2 % in Q1 2021.
From Q3 2015 to Q2 2019, there was a positive quarterly-on-quarterly (Q-o-Q) change in the number of recorded vehicle thefts across England and Wales before a period of negative Q-o-Q growth up until Q1 2021. This cycle repeated itself up until Q3 2024, when there was a drop of 1.4% in the number of reported vehicle thefts compared to Q2 2024.
Based on future projections, it’s anticipated that this quarterly decrease could happen throughout 2025-26, ranging between -0.17% and -0.19% per quarter.
Vehicle theft stats by age of vehicle
Between April 2022 and March 2023, almost two-fifths (39%) of vehicles reported stolen across England and Wales were more than five but less than 10 years old, making them the most commonly stolen vehicle age for this period.
This represents a 19 percentage point increase from April 2012 to March 2013, when almost half this amount was reported stolen for the year from this age bracket.
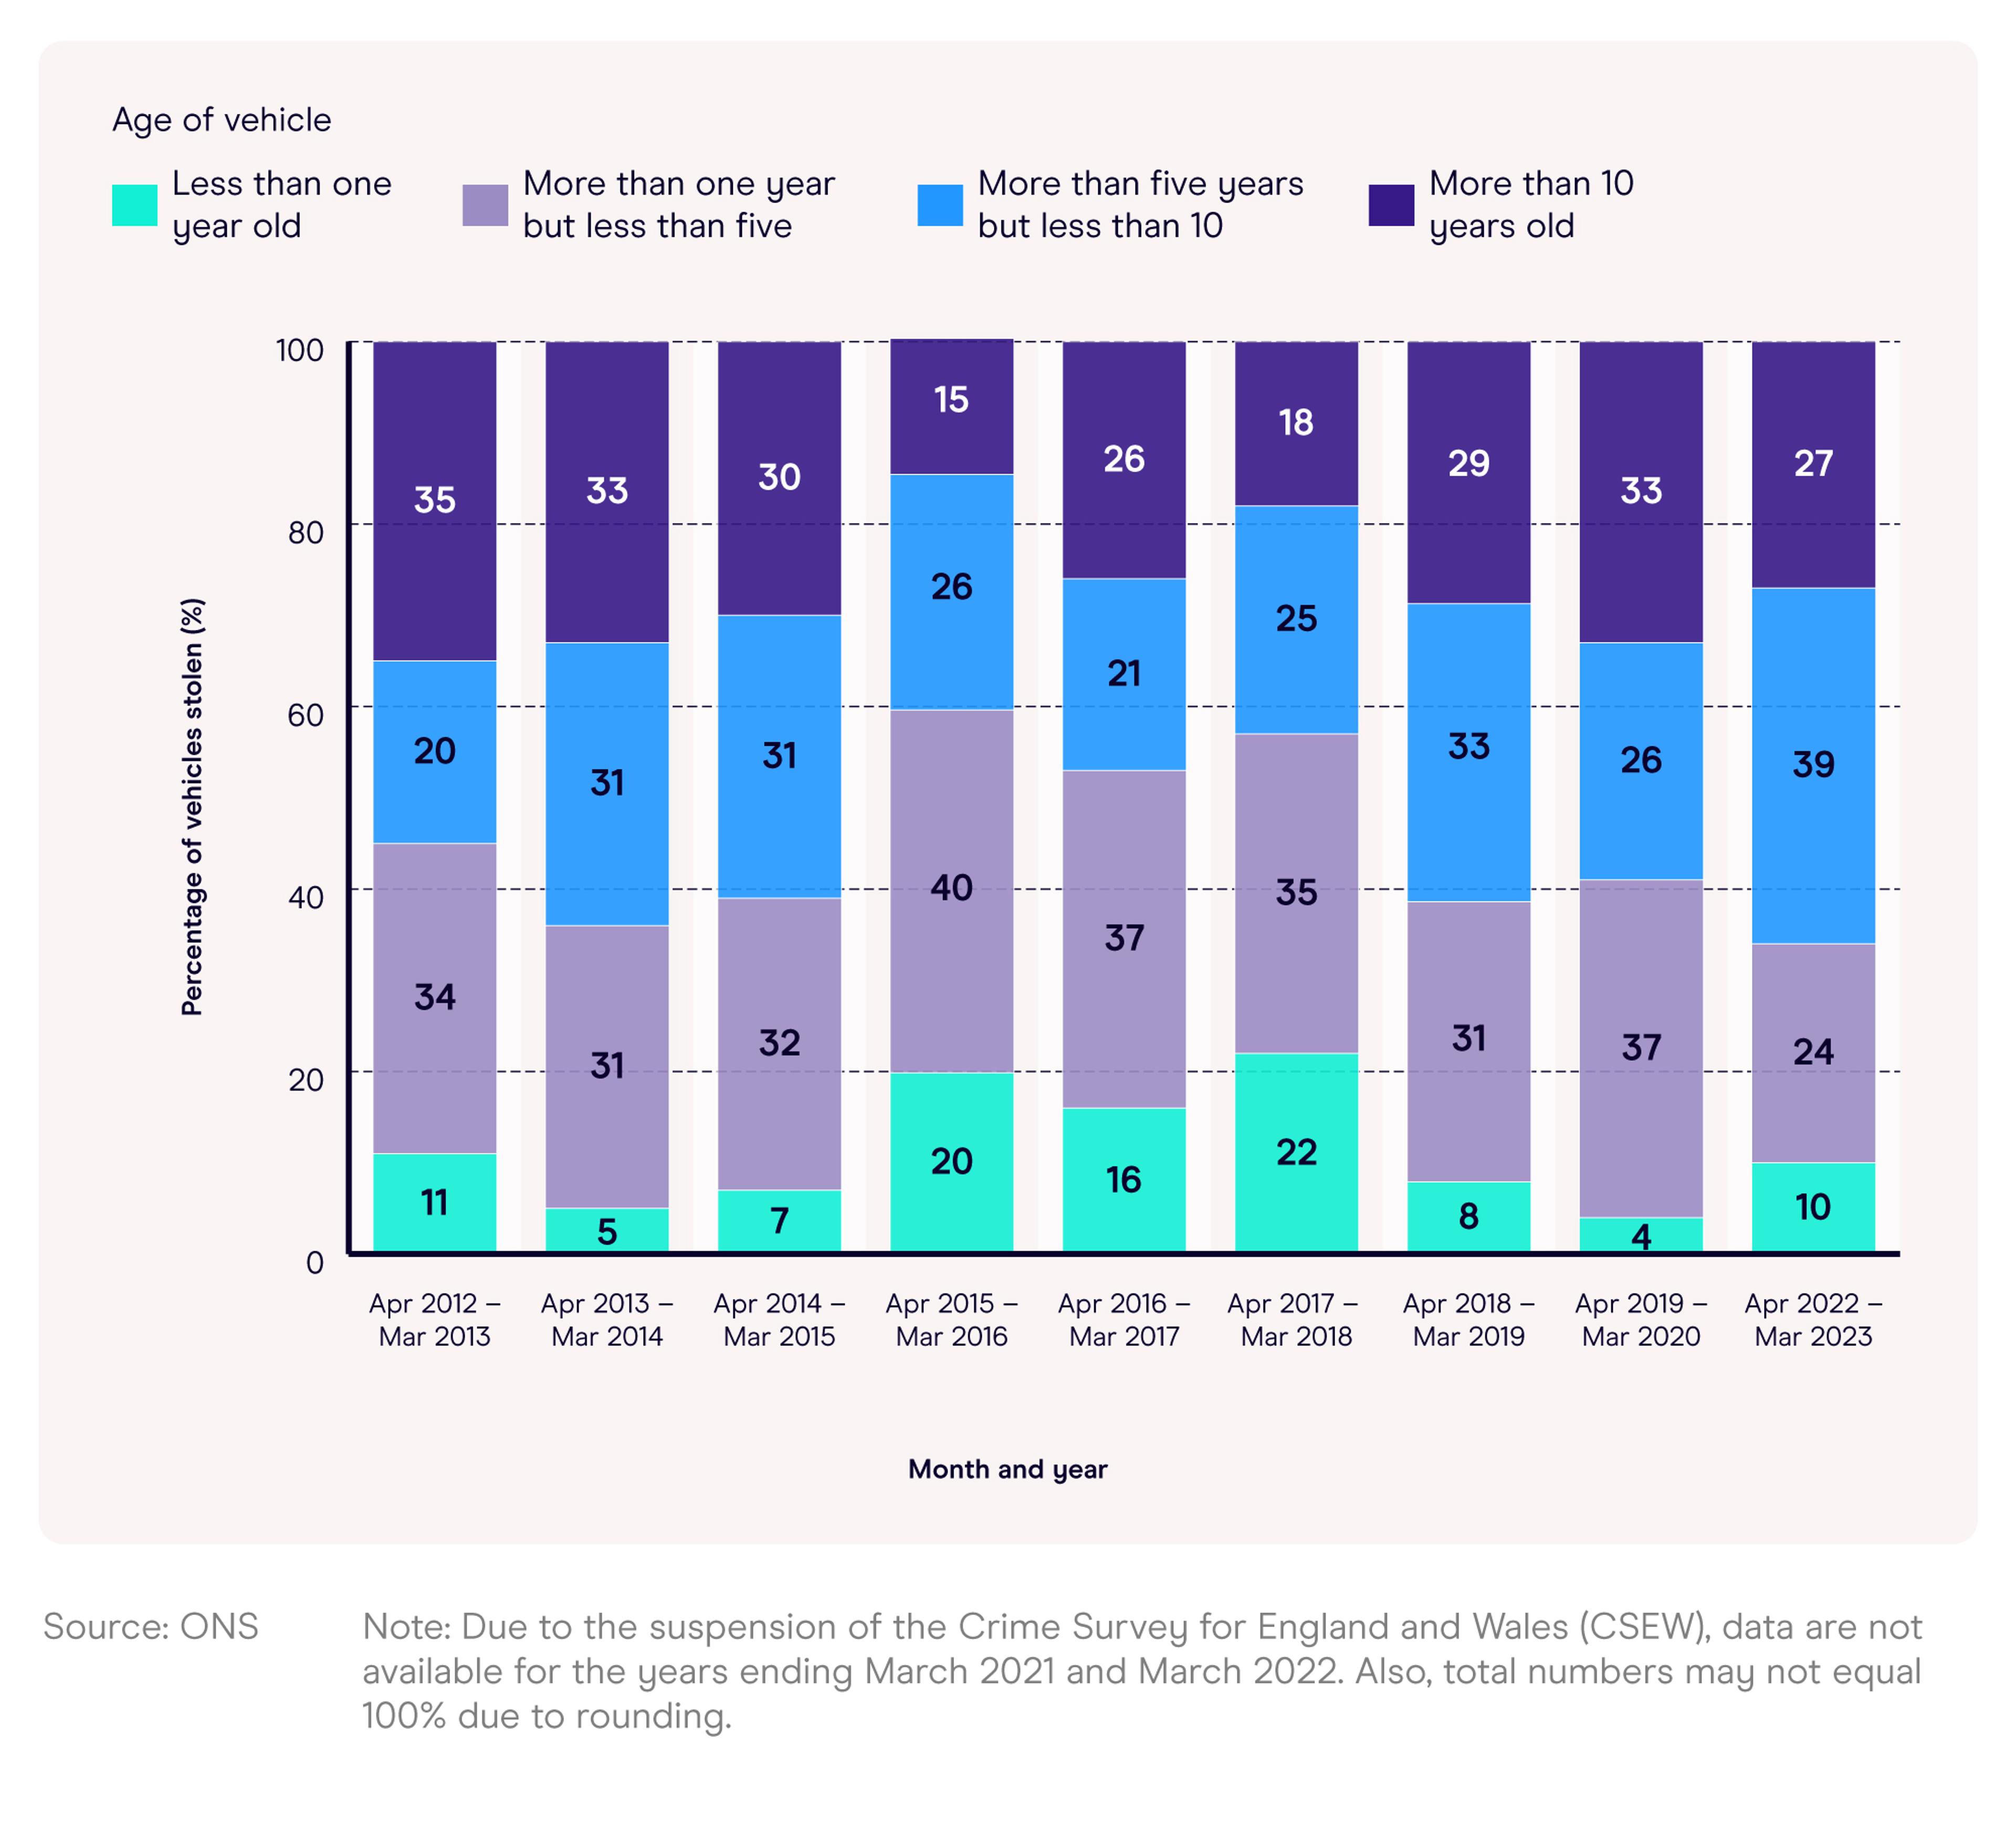
^ Percentage of vehicles stolen over time based on age of vehicle
Generally speaking, newer cars (i.e. those less than a year old) tend to be the least reported age for stolen vehicles. As of 2022-23, this represented around a tenth (10%) of the overall total – a significant drop of almost a half from 2017-18, when the respective figure stood at just over a fifth (22%) for the year.
Vehicle theft stats by car colour
According to car theft statistics from the DVLA, there were 17,181 black cars reported stolen between October 2022 and September 2023 making them the most commonly stolen coloured vehicle during this period.
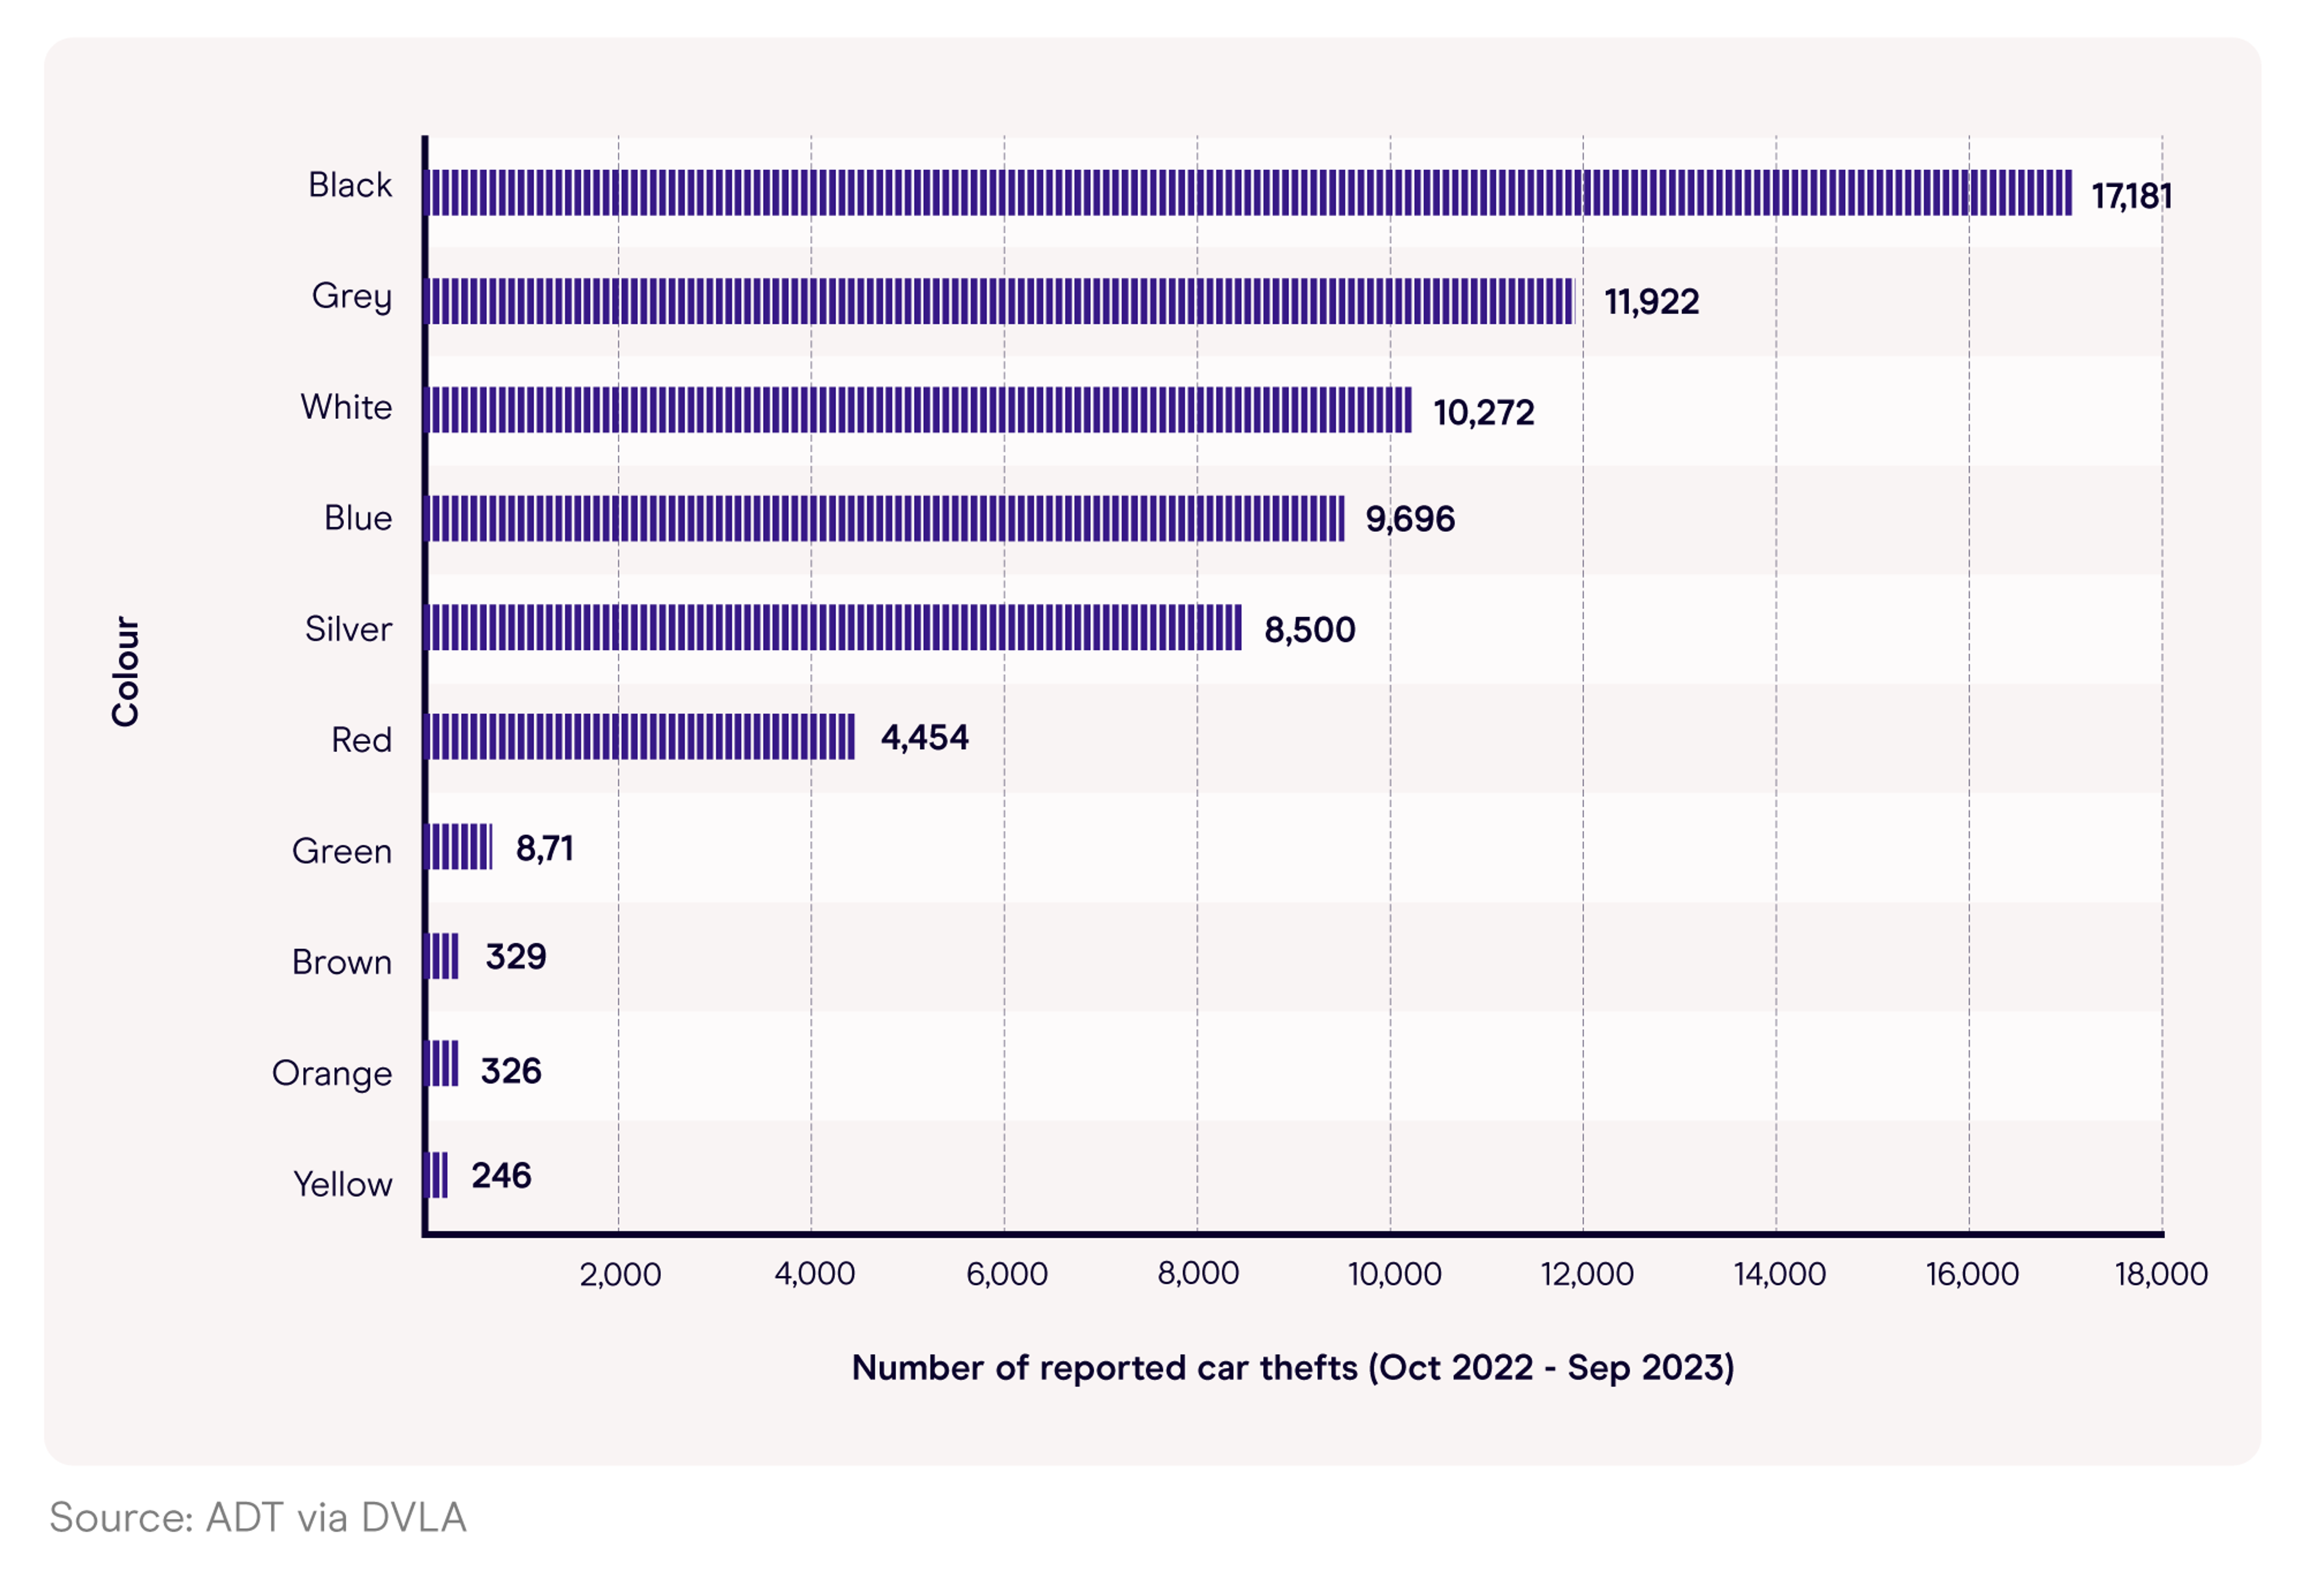
^ Car colours most targeted by car thieves in the UK
Over a third (36.1%) more black cars were reported stolen in 2022-23 compared to grey in second place and just over half (50.3%) more than the number of white vehicles in third.
At the other end of the scale, just 246 yellow cars were reported stolen to the DVLA between October 2022 and September 2023 – almost 70 times less than the number of black cars.
Vehicle theft stats by time of day
As of April 2022 - March 2023, almost three-quarters (72%) of reported vehicle thefts occurred during weekdays (a trend largely consistent since 2017-18).
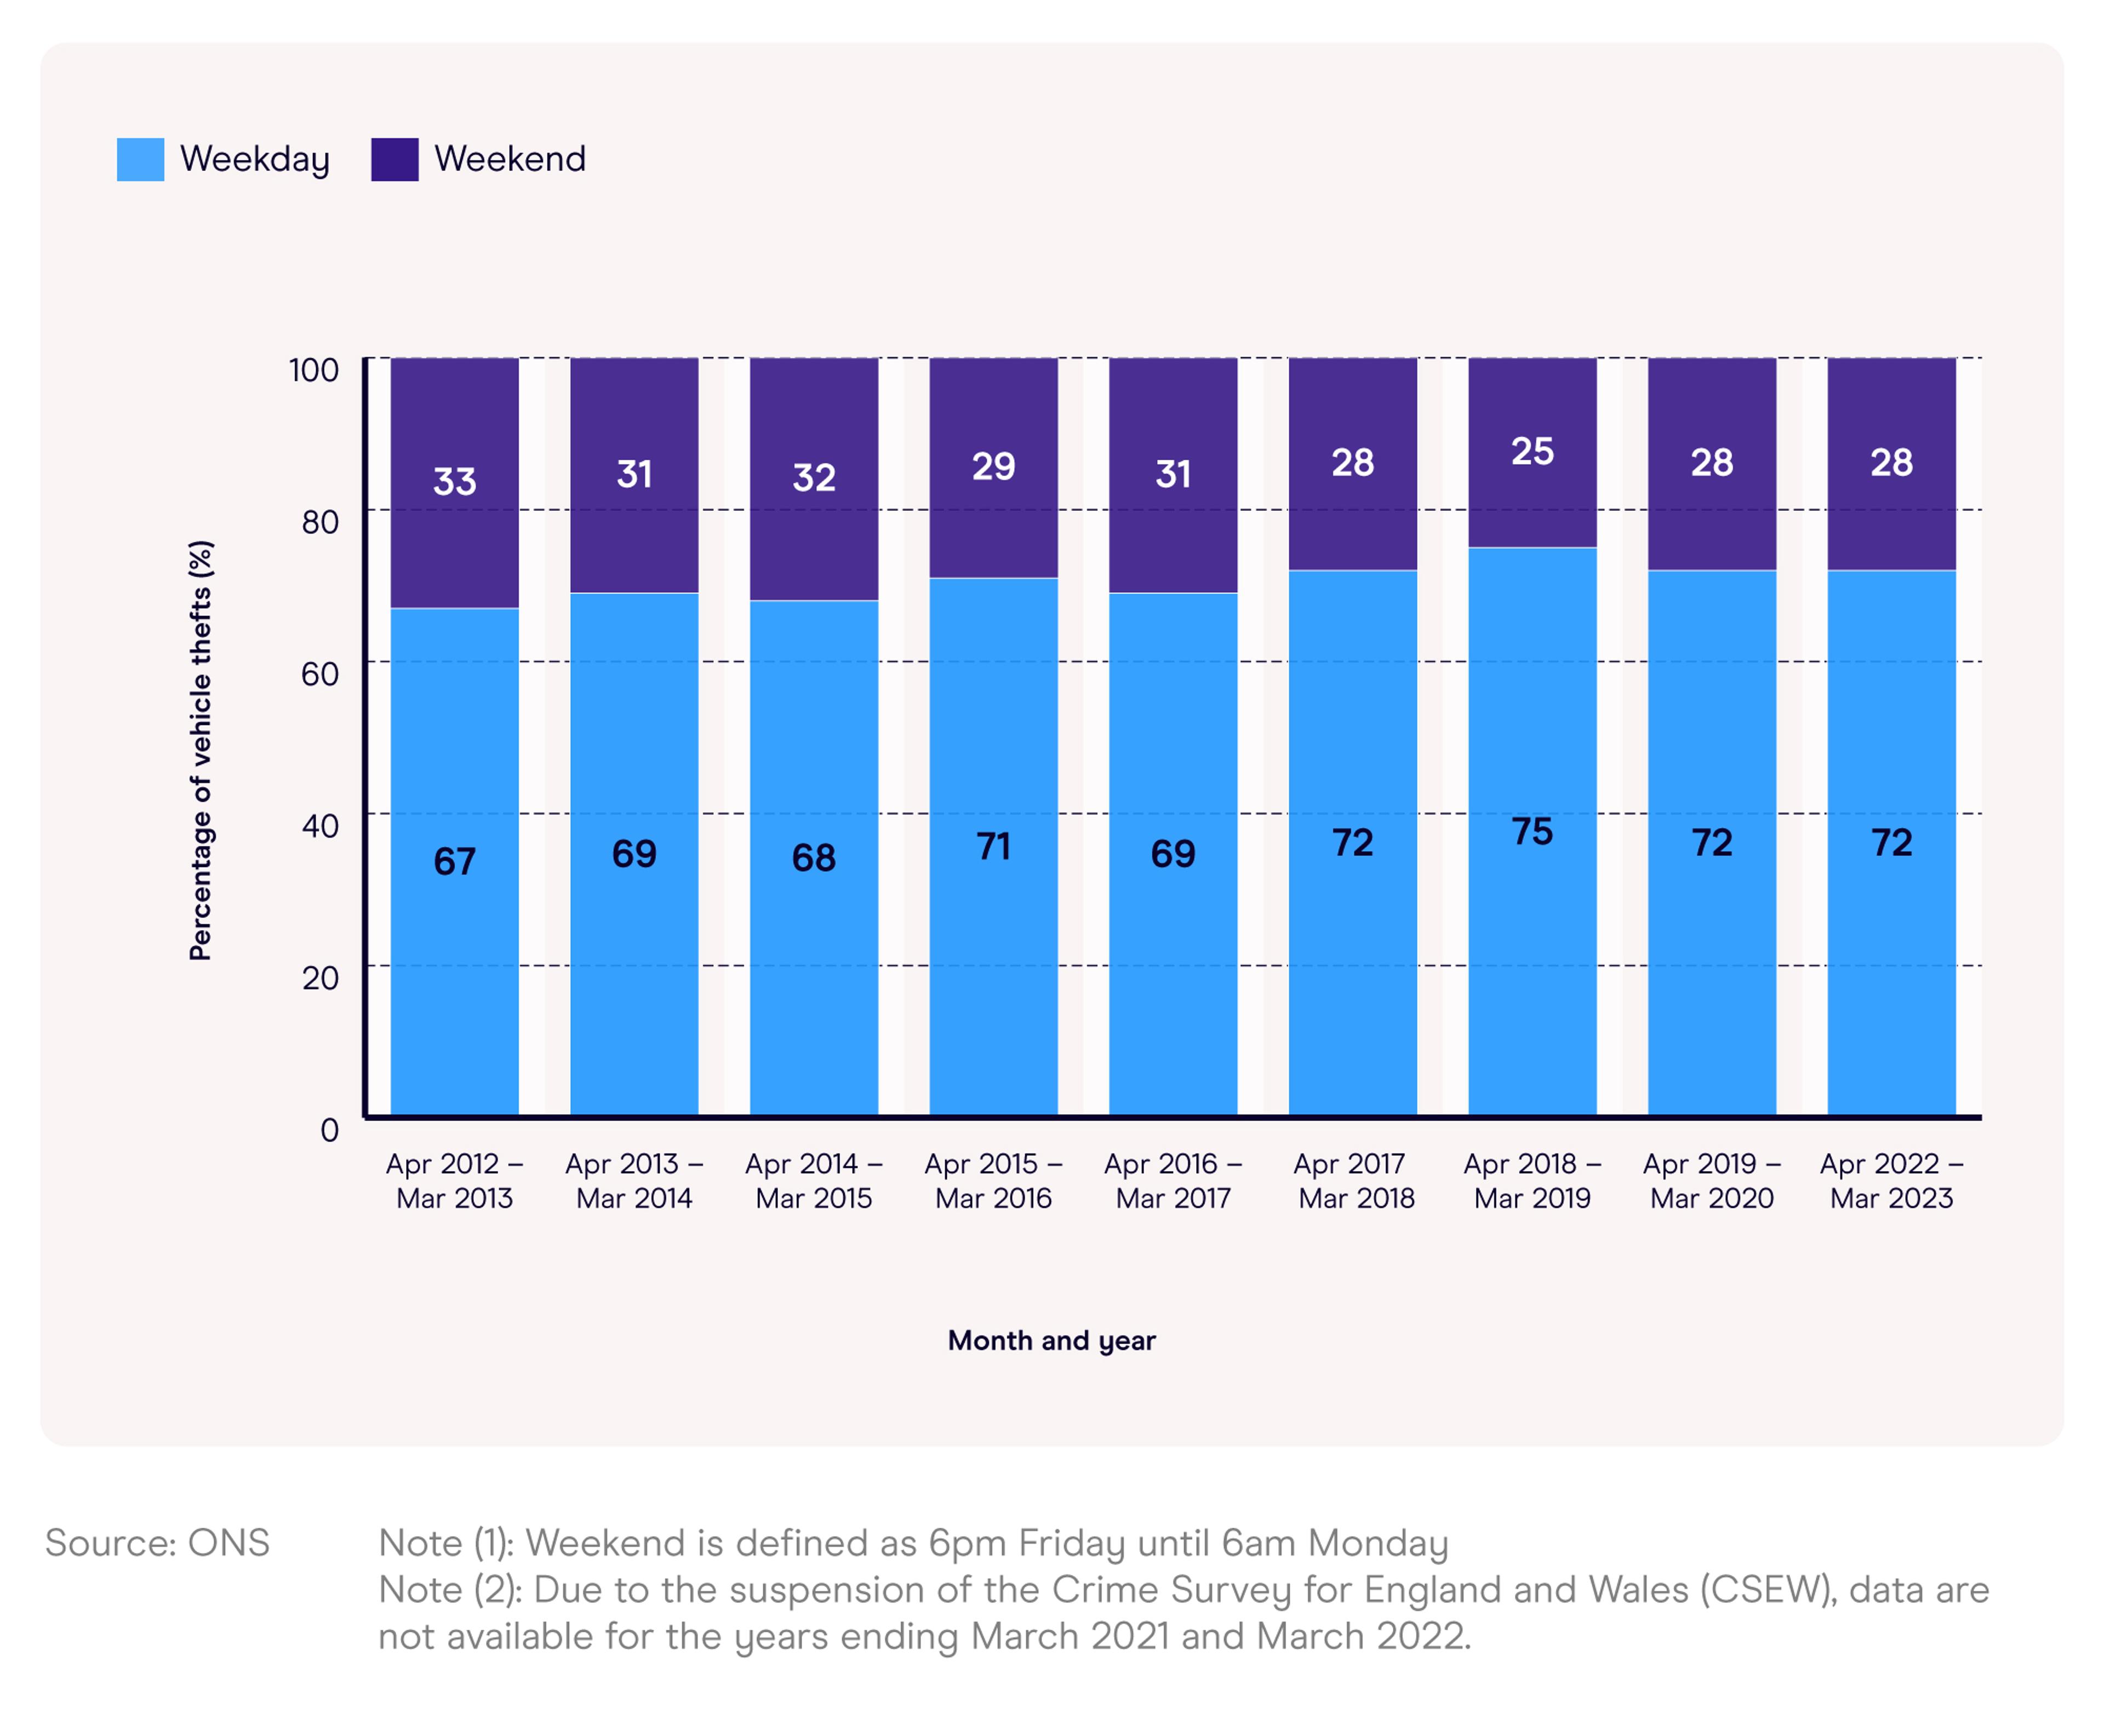
^ Percentage of vehicle thefts (weekday vs. weekend)
Before this, the figures were slightly lower, ranging between just over two-thirds (67%) in 2012-13 and around seven-tenths (71%) in 2015-16.
Percentage of vehicle thefts (morning/afternoon vs. evening/night)
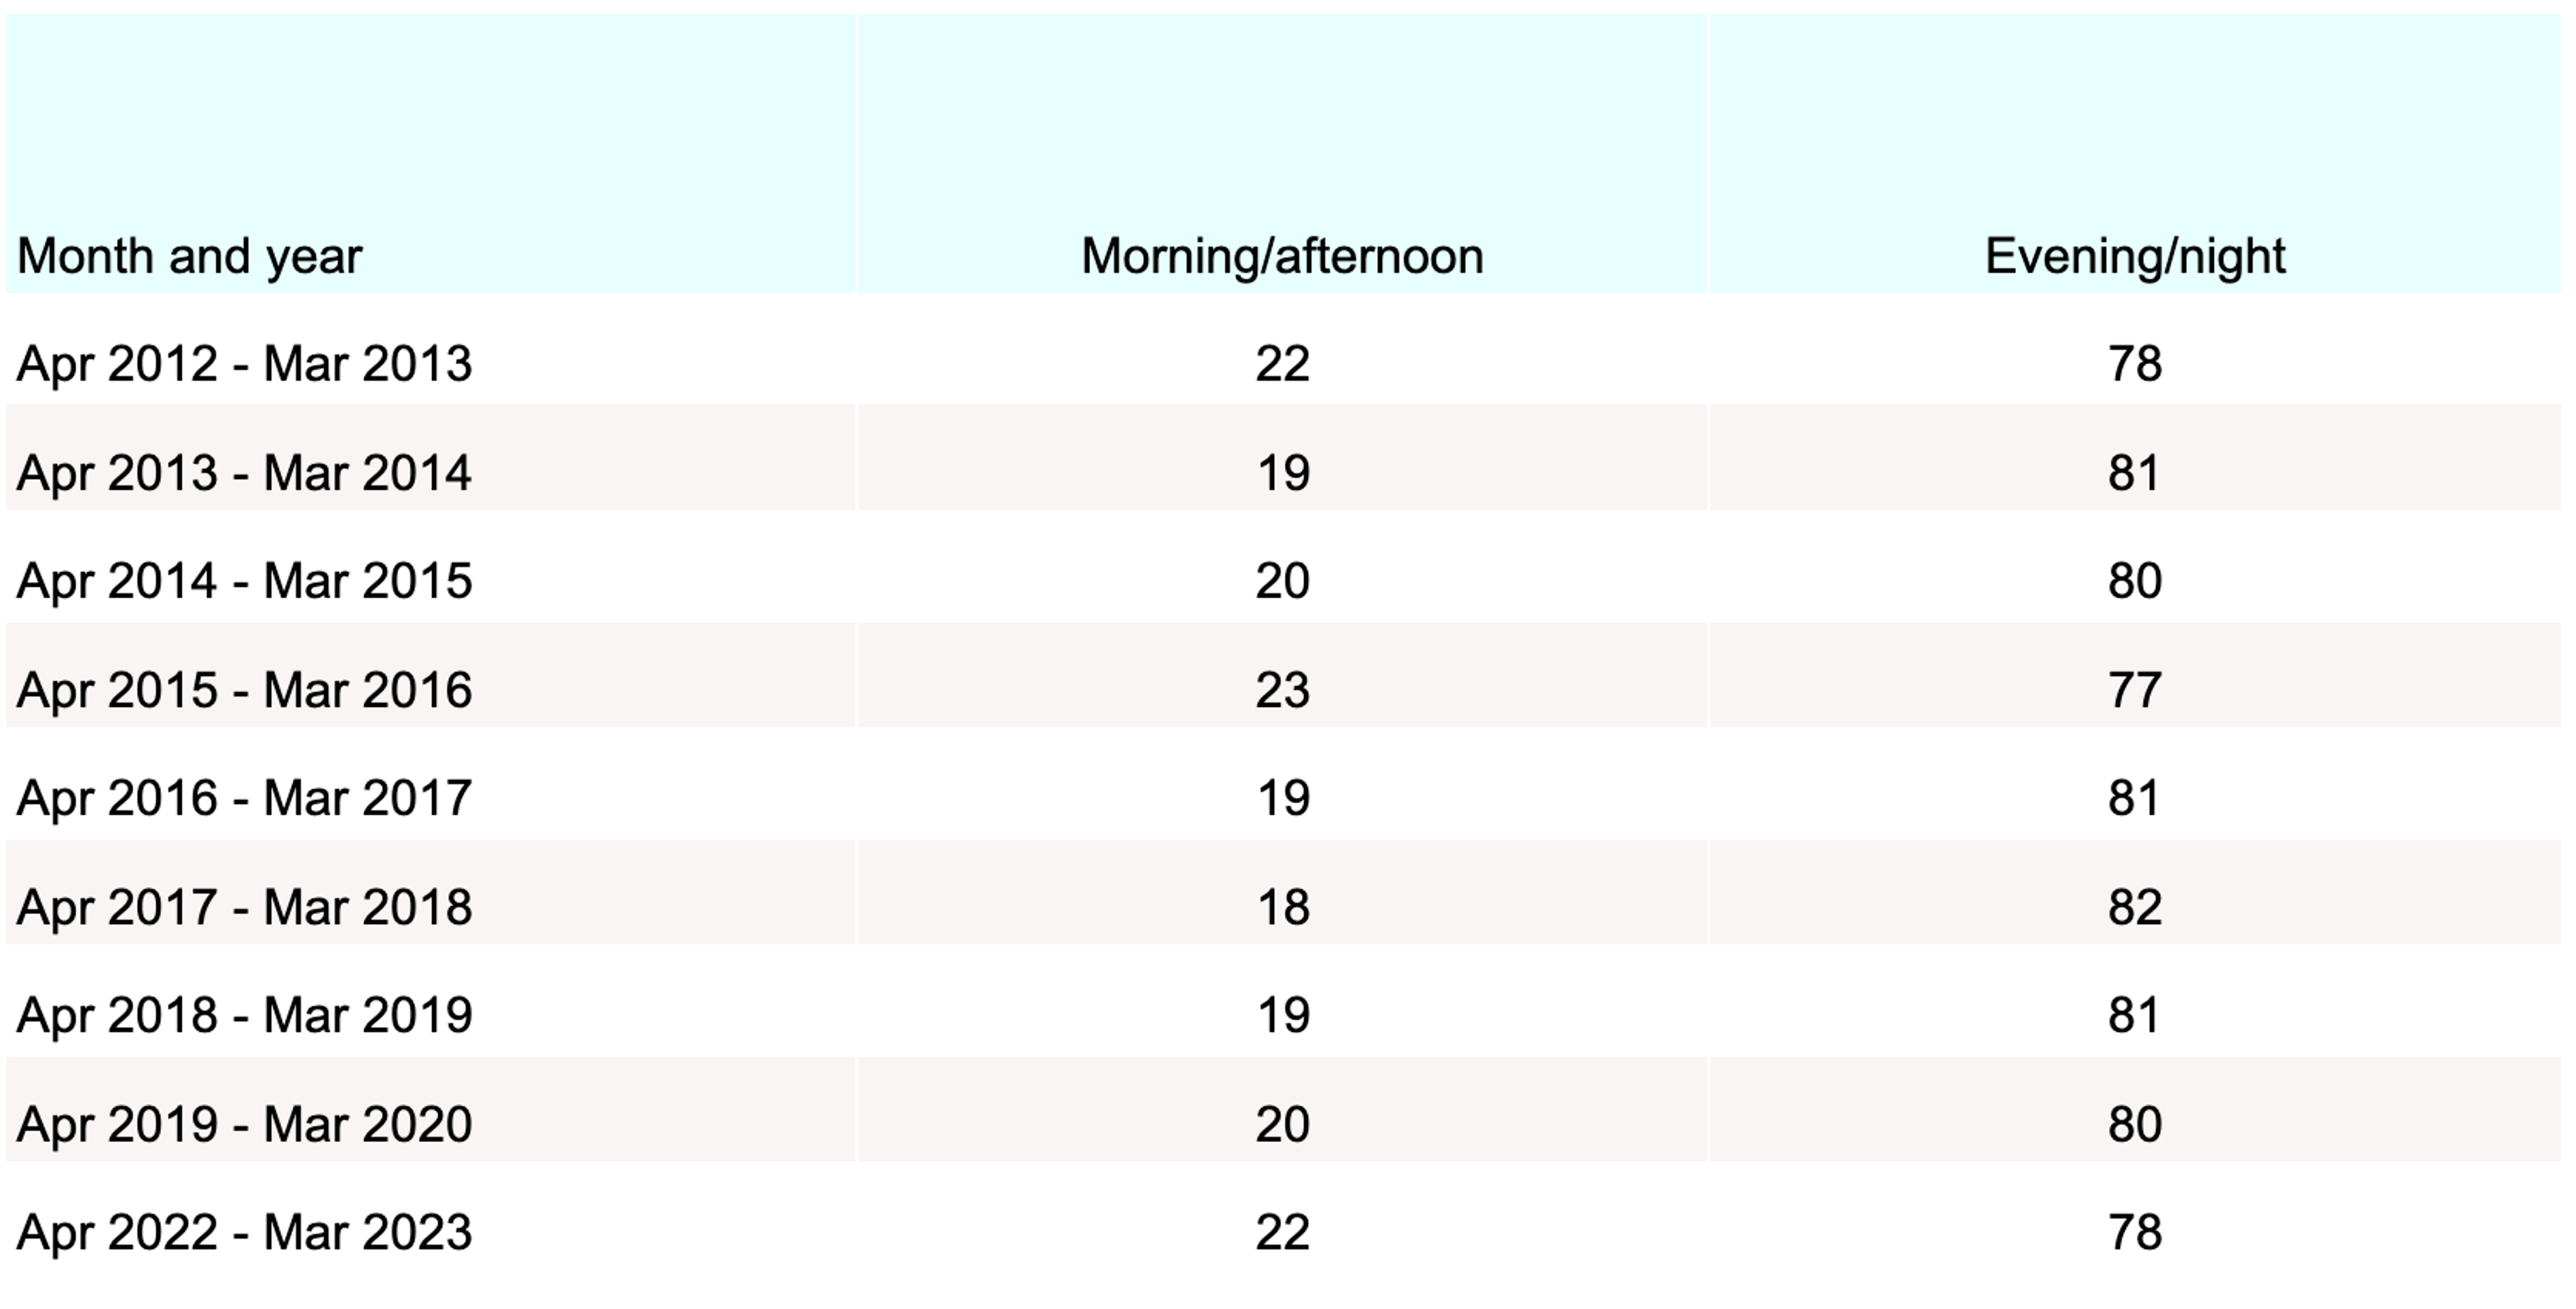
(Source: ONS)
Note (1): Morning/afternoon is defined as 6am-6pm; evening/night is defined as 6pm-6am.
Note (2): Due to the suspension of the Crime Survey for England and Wales (CSEW), data are not available for the years ending March 2021 and March 2022.
As perhaps expected, the vast majority of vehicles are stolen during the evening/night. As of April 2022 - March 23, this figure stood at just over three-quarters (78%) of all reported thefts for the year.
However, the percentage of reported vehicle thefts in the evening/night exceeded four-fifths on multiple occasions over the previous decade, reaching a high of 82% in 2017-18.

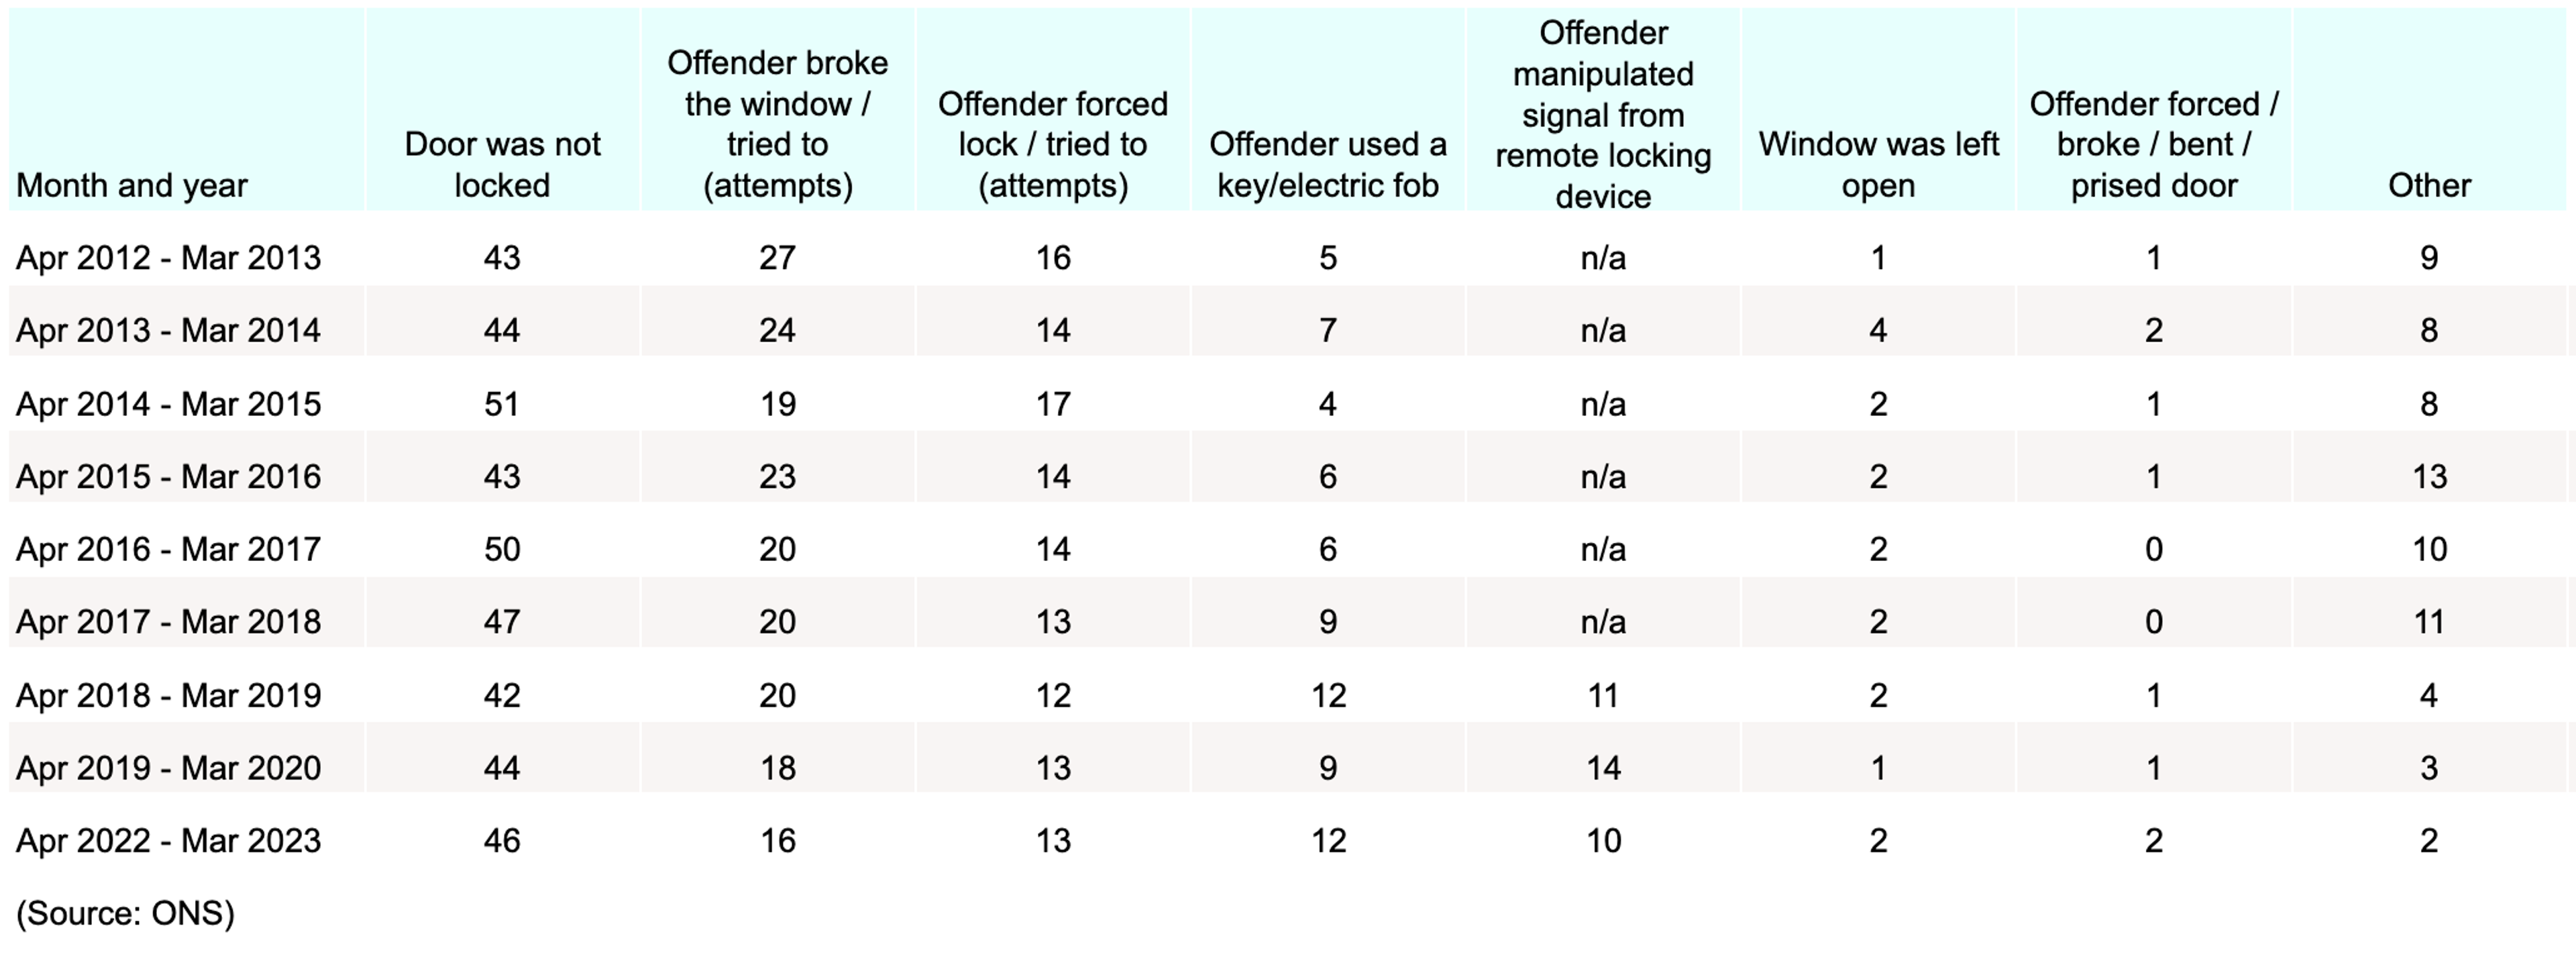
Most common method of entry for attempted vehicle thefts
Less than half (46%) of the number of people who reported an attempted break-in of their vehicle between April 2022 and March 2023 were due to the car being left unlocked. This made it the most common method of entry for potential car thieves throughout the year. This is a trend that has prevailed over the past decade, reaching a high of 51% in 2014-15.
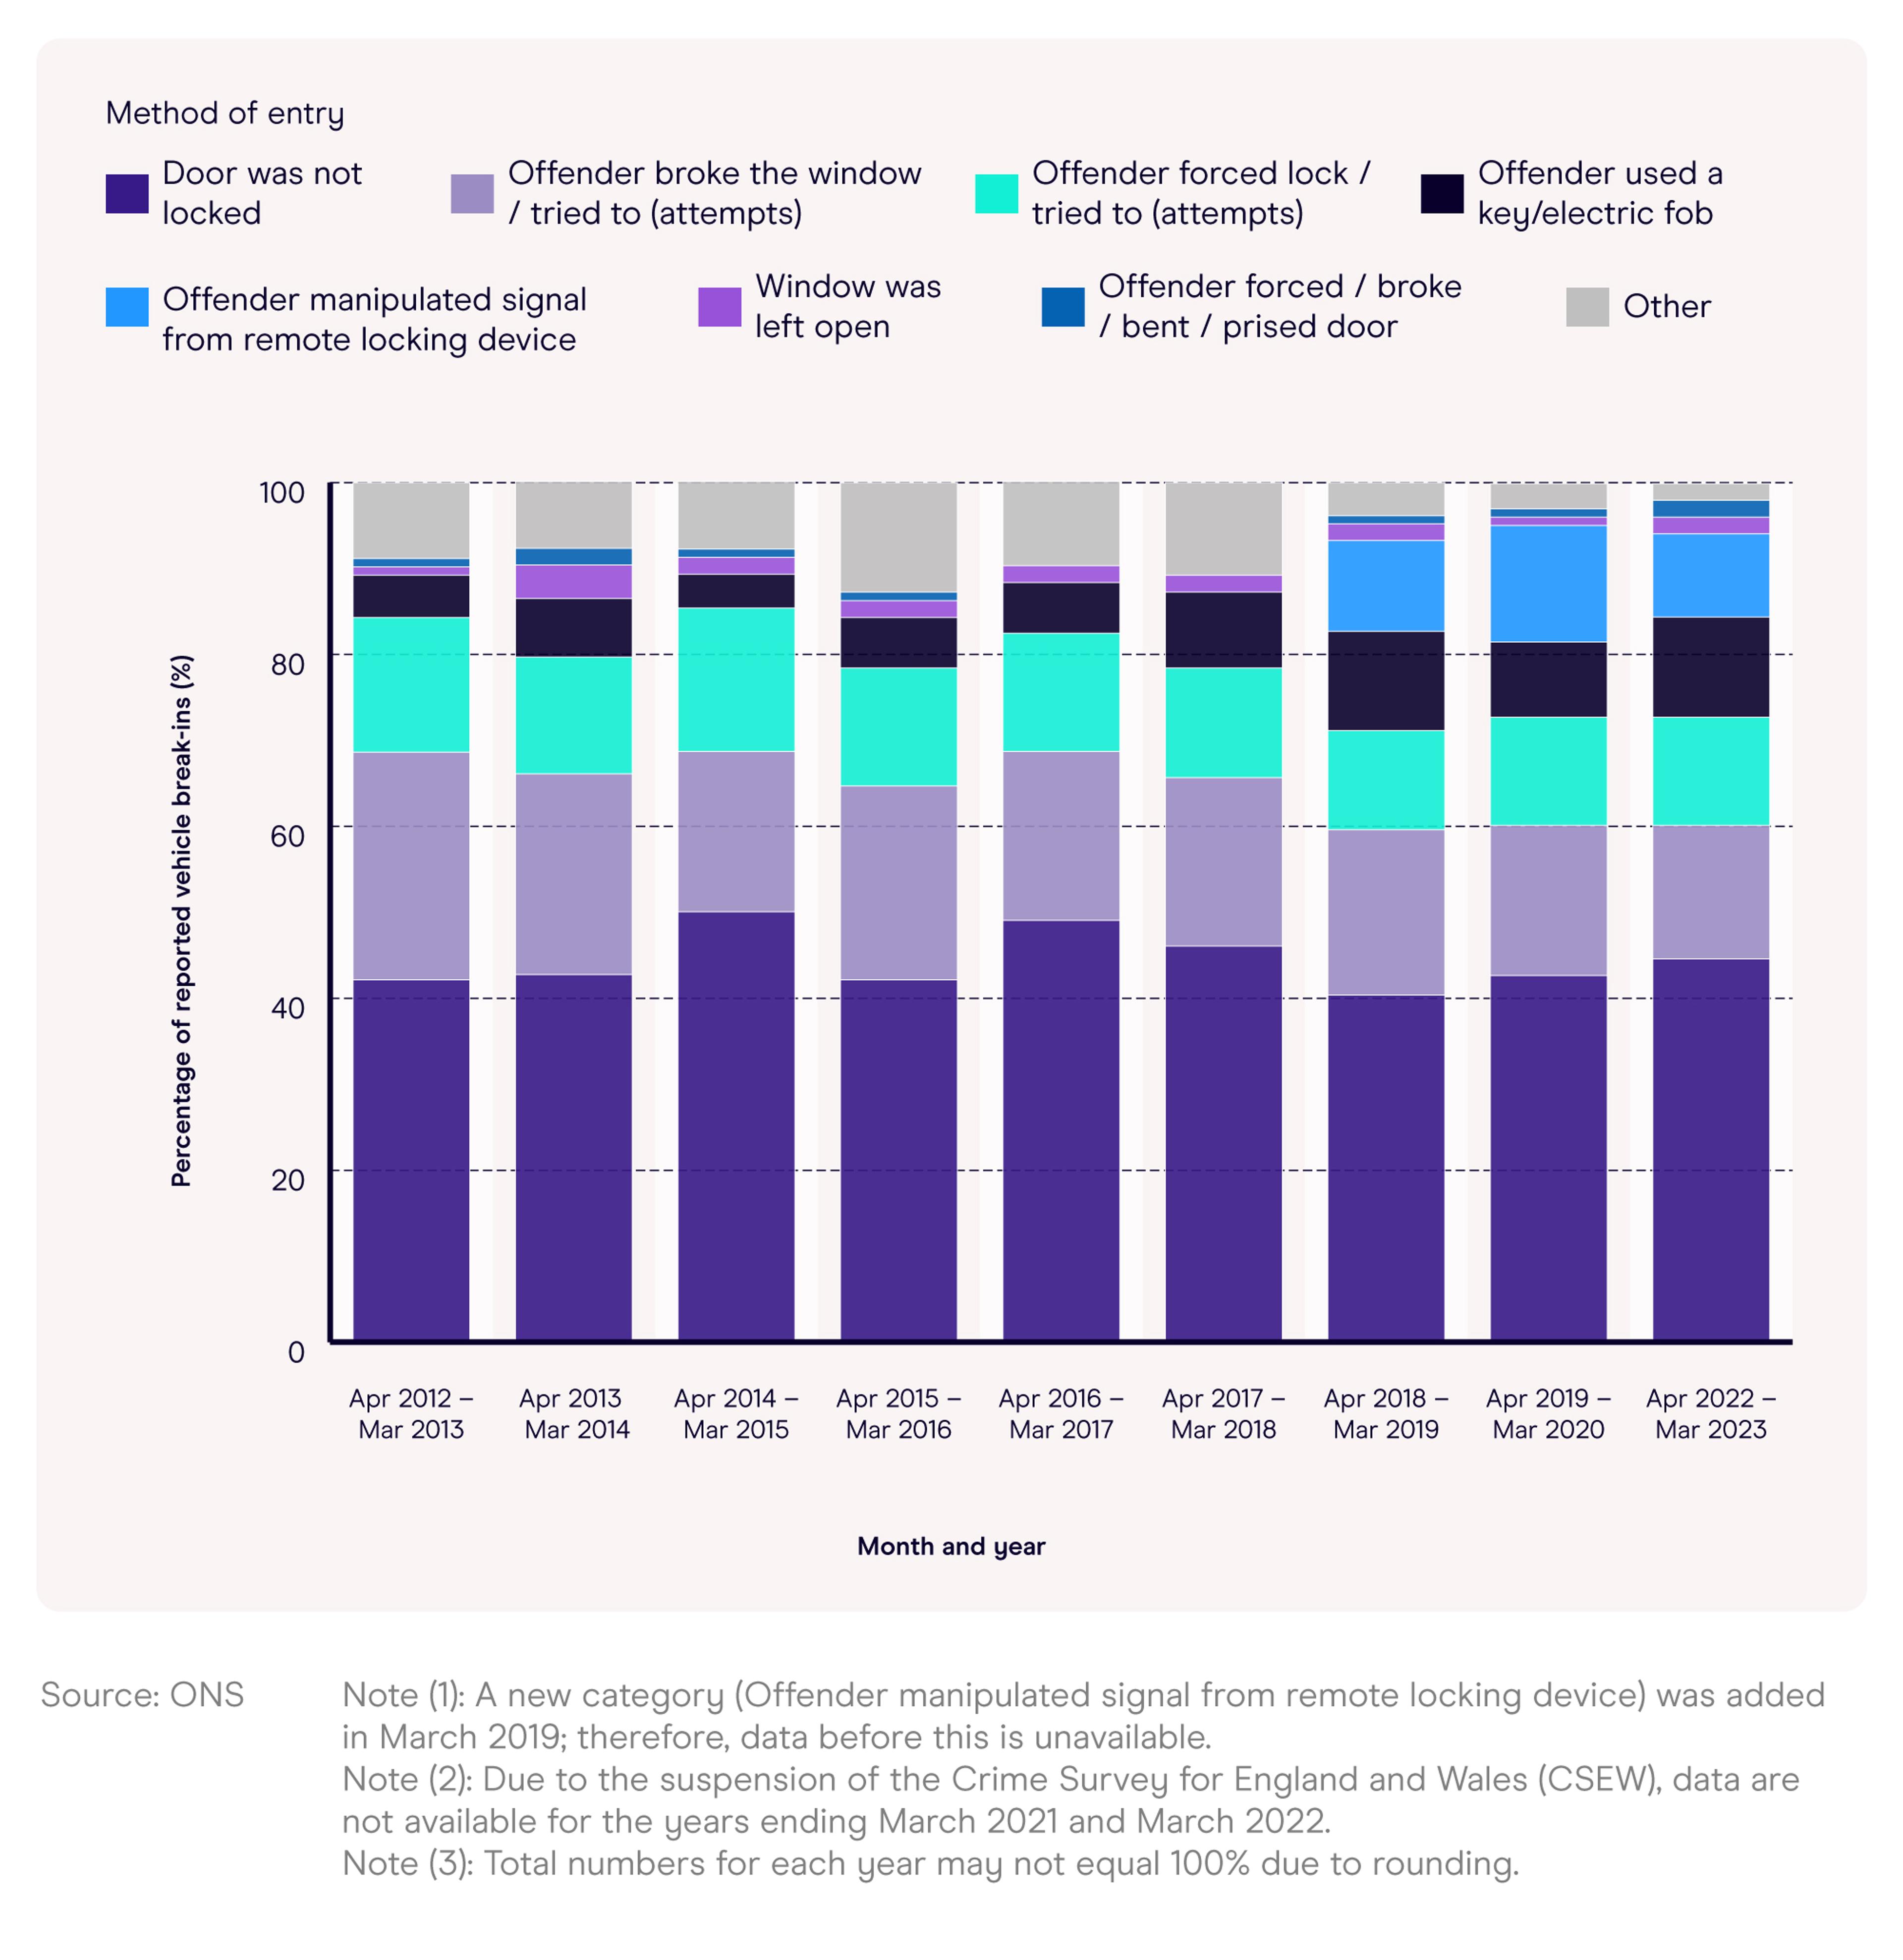
^ Percentage of reported vehicle break-ins by attempted method of entry
Note (1): A new category (Offender manipulated signal from remote locking device) was added in March 2019; therefore, data before this is unavailable.
Note (2): Due to the suspension of the Crime Survey for England and Wales (CSEW), data are not available for the years ending March 2021 and March 2022.
Note (3): Total numbers for each year may not equal 100% due to rounding.
This is followed by around a sixth (16%) of vehicles in 2022-23 where a potential break-in happened via a broken window/trying to break a window – a 10-percentage-point decrease from 10 years earlier.
Note (1): A new category (Offender manipulated signal from remote locking device) was added in March 2019; therefore, data before this is unavailable.
Note (2): Due to the suspension of the Crime Survey for England and Wales (CSEW), data are not available for the years ending March 2021 and March 2022.
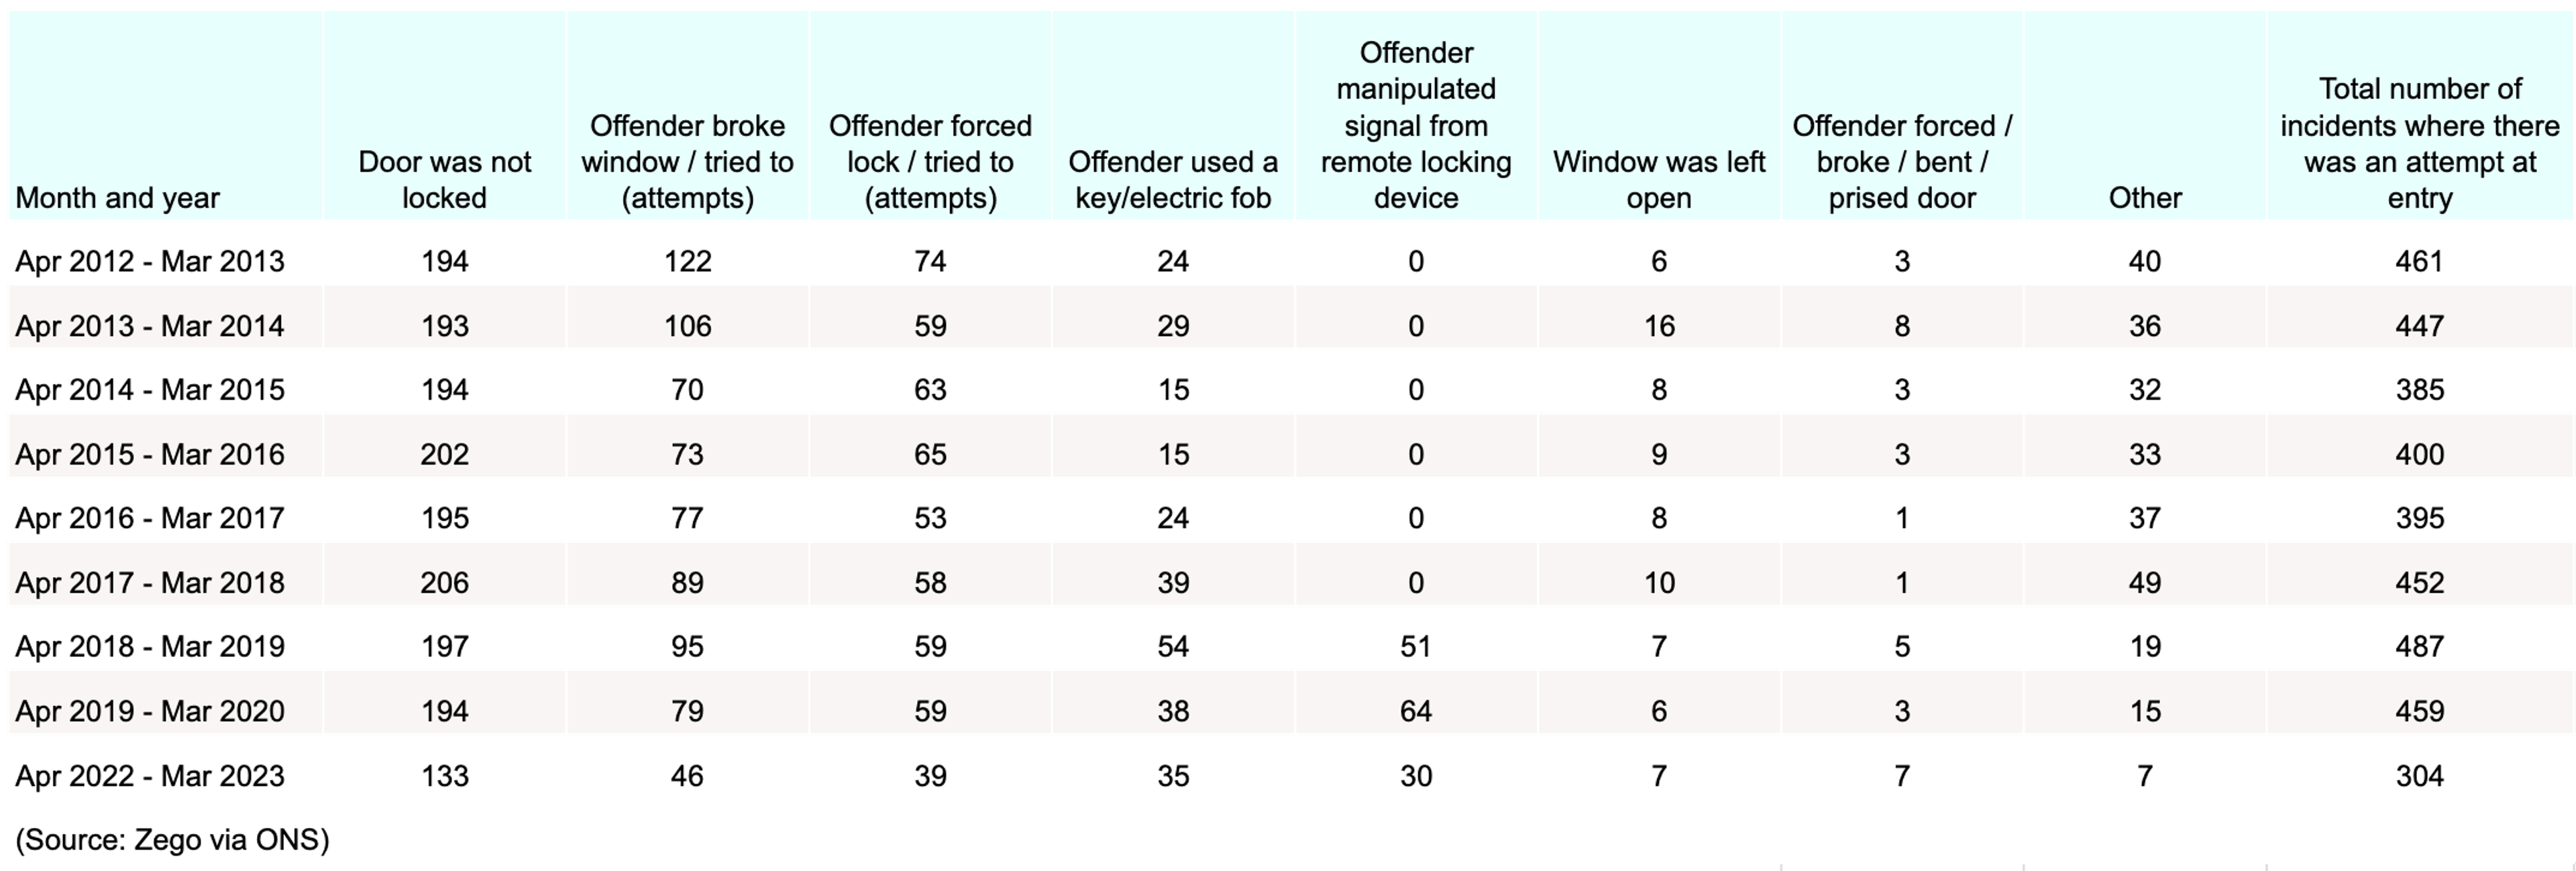
The number of reported incidents of attempted vehicle break-ins across England and Wales fluctuated year-on-year between 2012-23, reaching a peak of 487 between 2018-19 and a low of 304 in 2022-23. This represented a drop of almost two-fifths (37.6%) in the space of five years.
Reported cases of attempted entry to vehicles in 2022-23 were highest for the door not being locked (133) – almost three times more common than the offender breaking/trying to break a window to gain entry.
Incidentally, attempting to break into a vehicle via an unlocked door was the most common reported method each year between 2012-23, reaching a high of 206 recorded cases in 2017-18 (a figure that had reduced by more than a third (35.4%) by 2022-23).
Other noticeable trends in the data between 2012-23 include:
- Offender broke/attempted to break a window - down by more than three-fifths (62.3%)
- Offender forced/attempted to force a lock - down by almost half (47.3%)
- Offender used an electric key/fob - up by almost half (45.3%)
What percentage of stolen vehicles are returned to their owners?
Generally speaking, less than half of those who fall victim to vehicle theft have their vehicles returned to them. This figure stood at just over two-fifths (44%) in 2022-23 and more than a quarter (28%) in 2019-20 (a record low over the decade 2012-13 to 2022-23). This means that almost three-quarters (72%) of those who reported a vehicle stolen between April 2019 and March 2020 never saw those vehicles again.
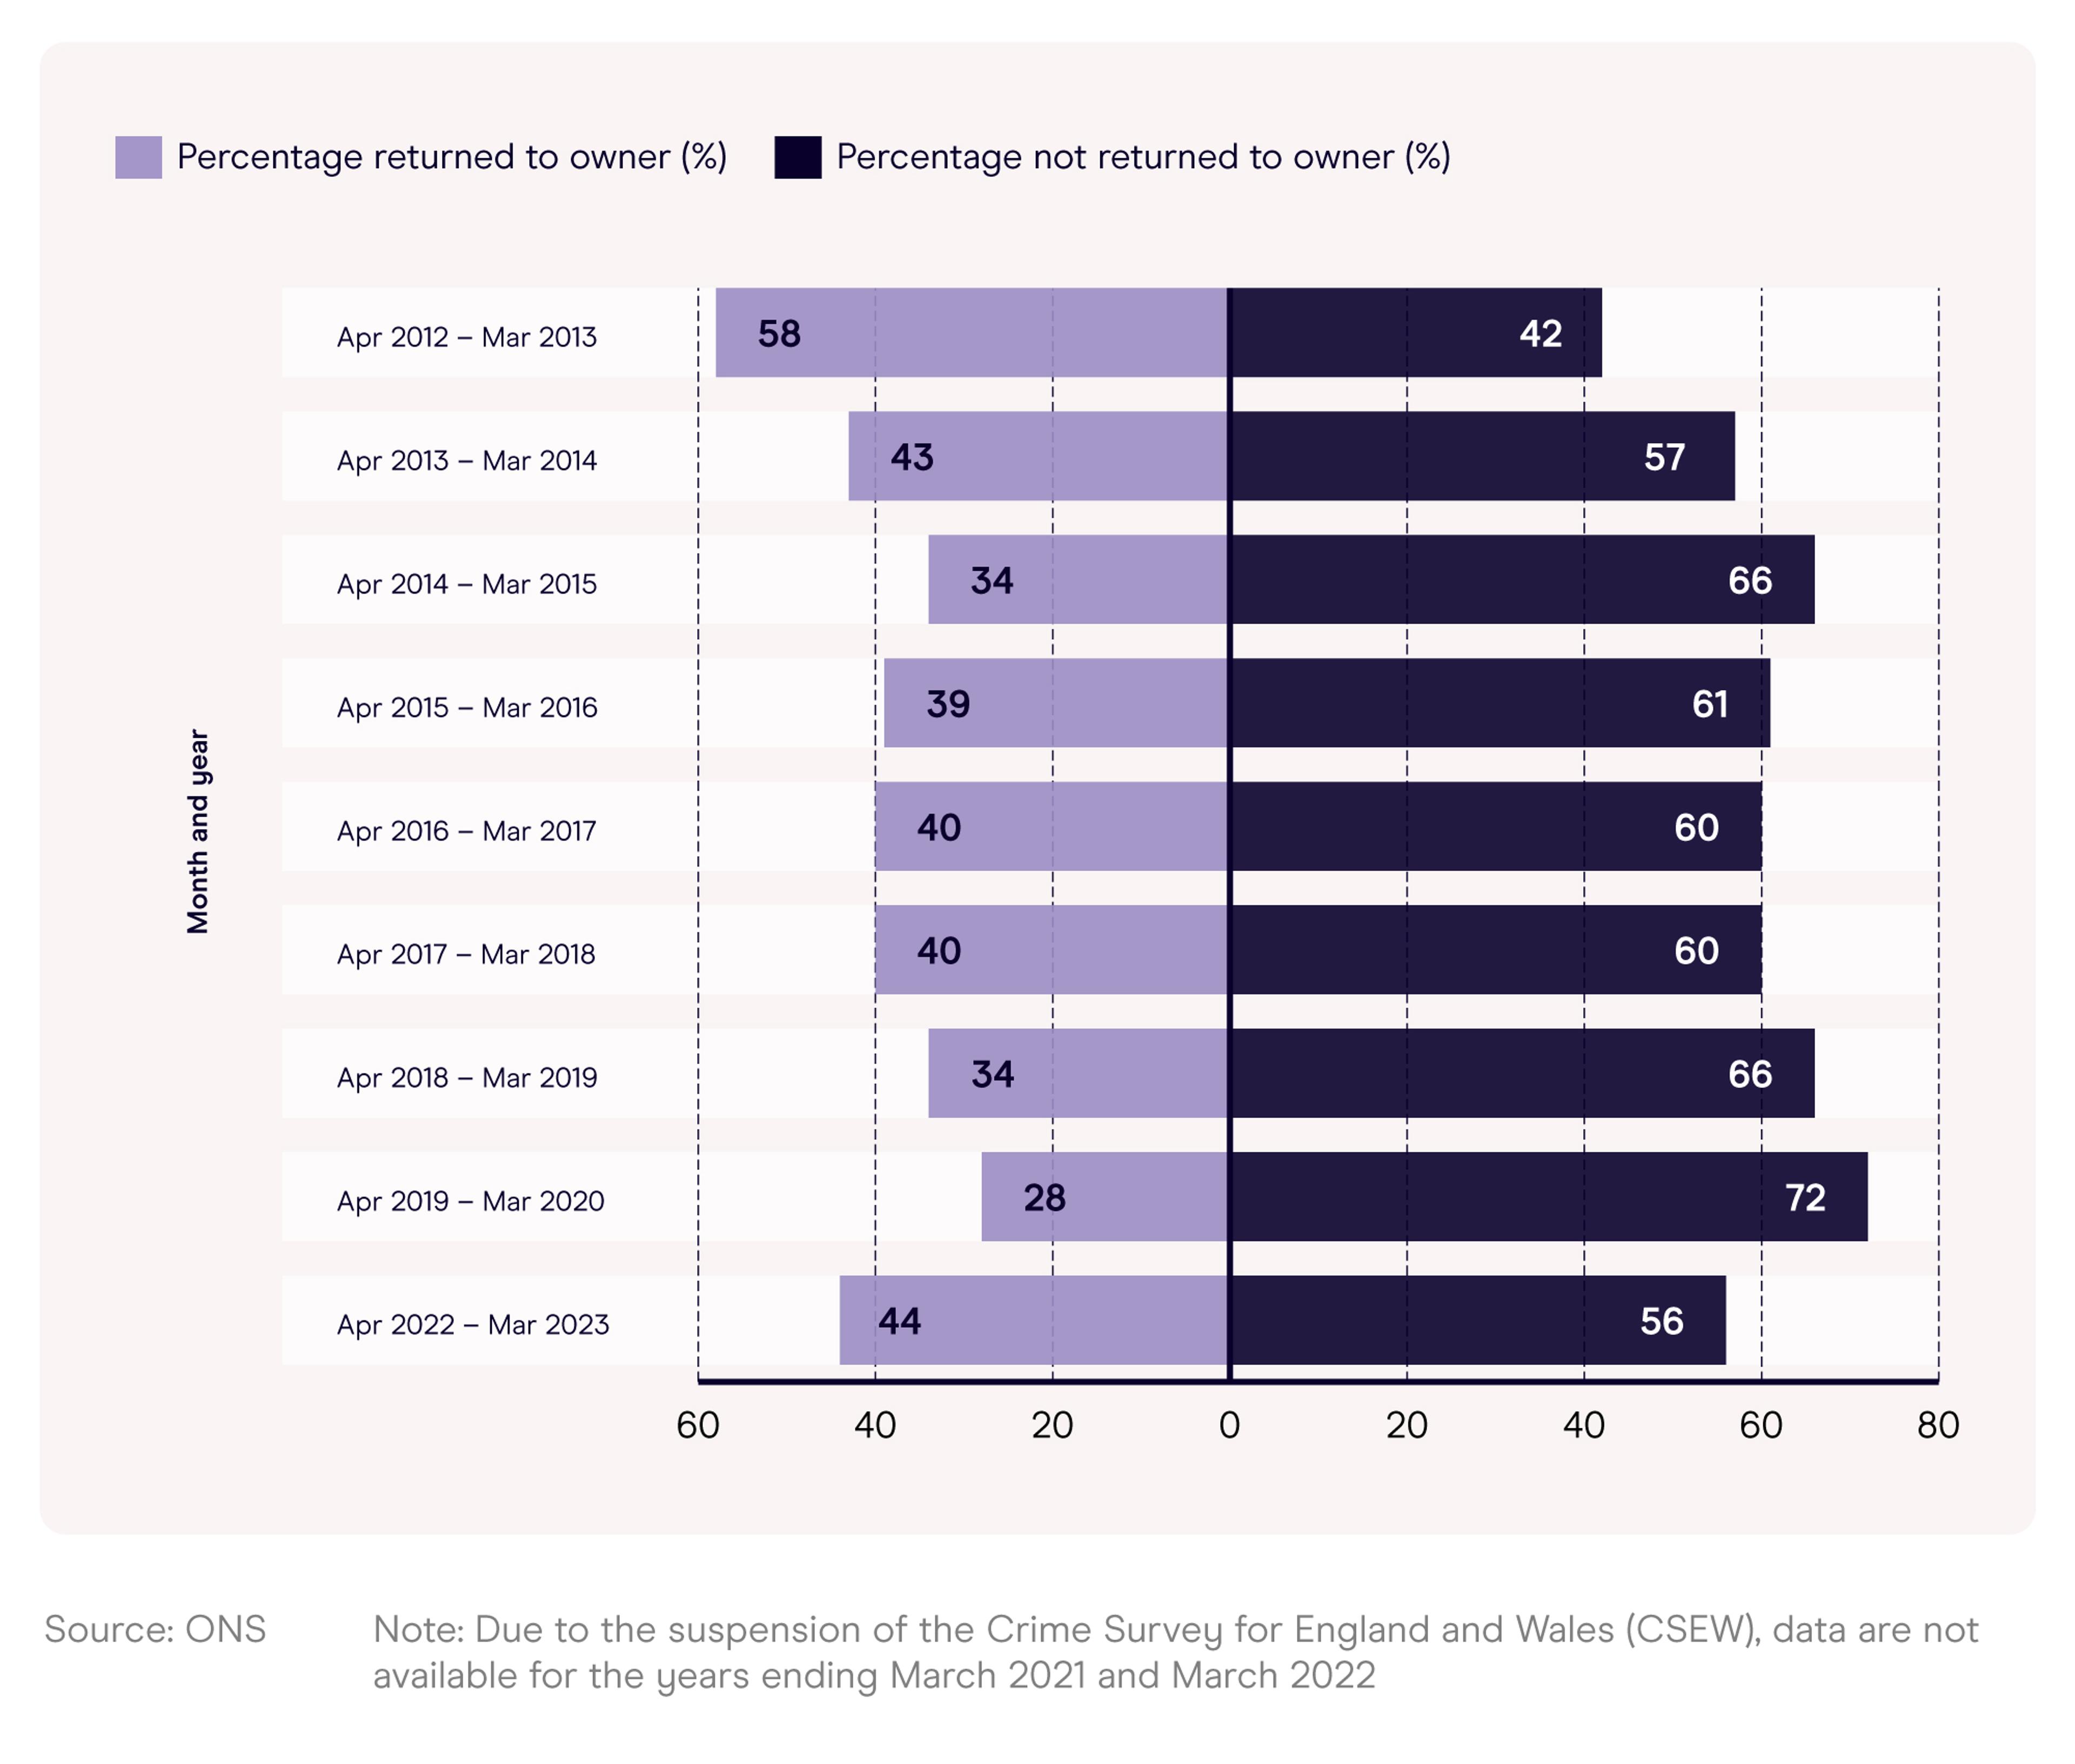
^ Percentage of stolen vehicles that are returned to owners vs. percentage that are not
A recent exception to this was in 2012-13, when almost three-fifths (58%) of stolen vehicles were returned to their owners. However, since then, figures have fluctuated between 28% and 44%.
Where do most vehicle thefts occur in the UK?
Regional vehicle theft stats across England and Wales
According to the most recent vehicle theft statistics for England and Wales, London has the most reported vehicle thefts of any region, with 105,211 recorded cases in the year ending September 2024. This represents more than a quarter (28.1%) of all recorded thefts across both countries combined and just over a fifth (22.1%) of all reported thefts in the capital.
Number and percentage of reported vehicle theft for each region of England and Wales
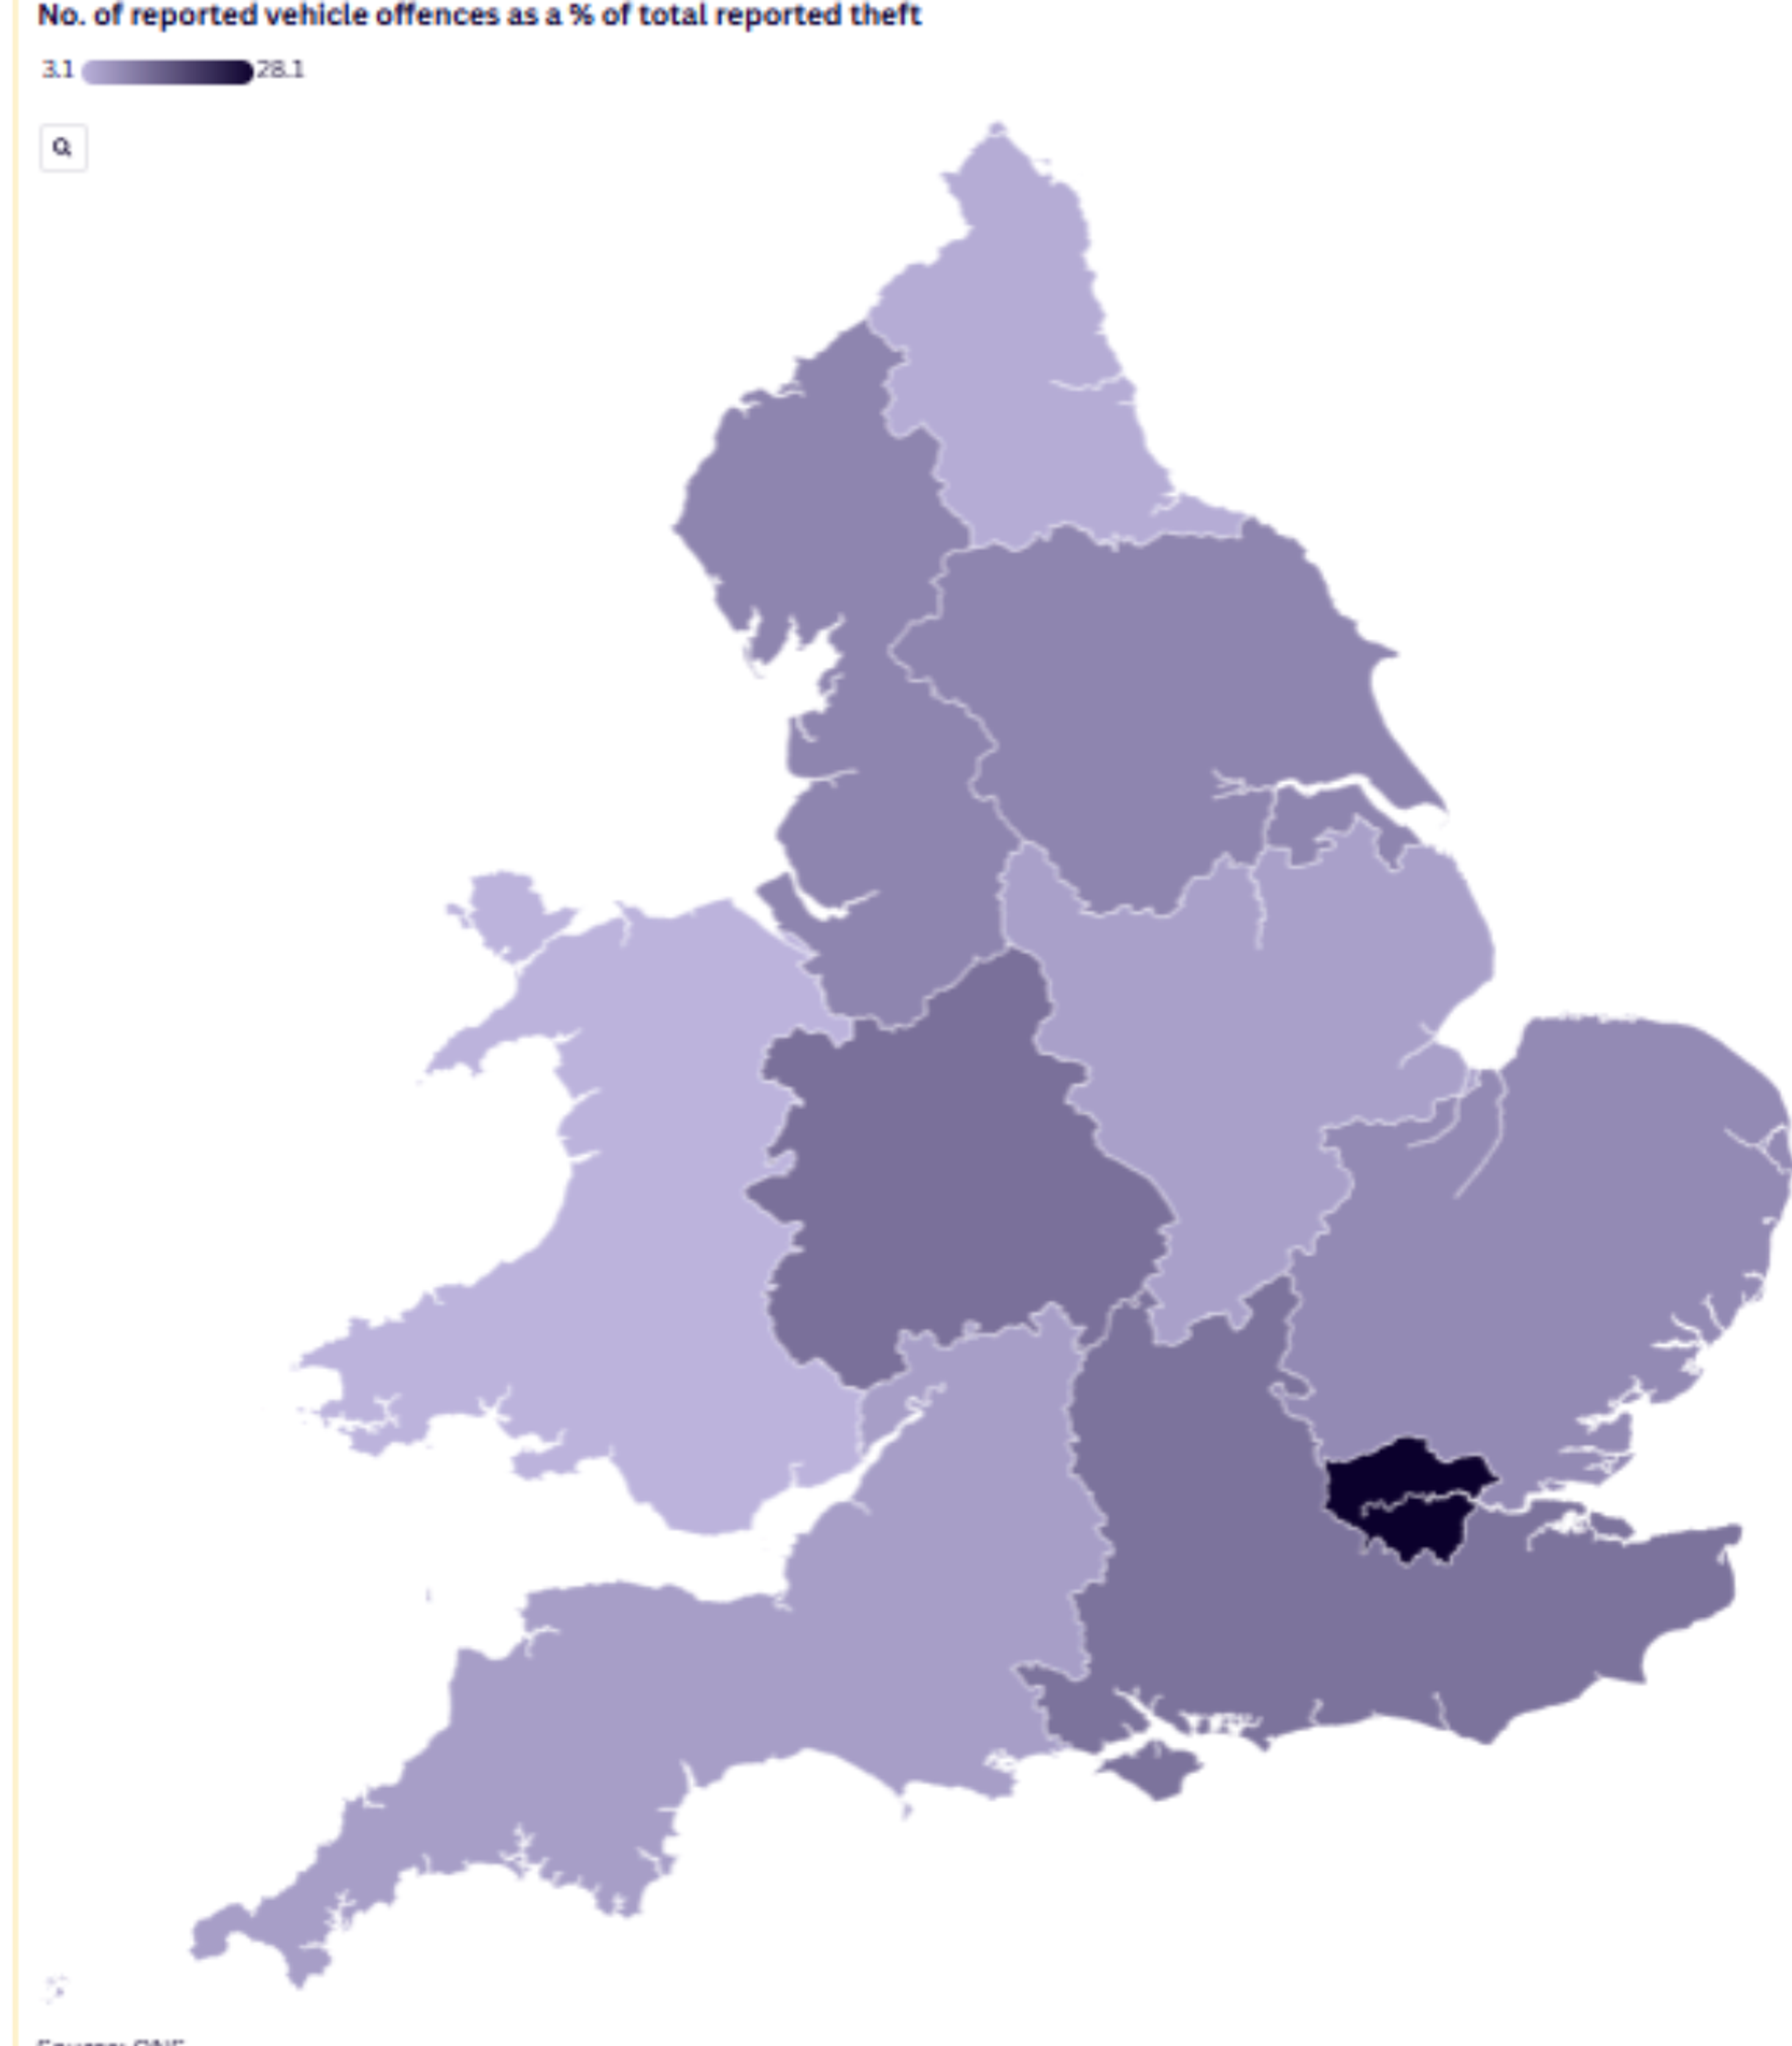
^ Number and percentage of reported vehicle theft for each region of England and Wales
By contrast, the West Midlands had more than half the number of reported vehicle thefts in September 2024, at 46,568. Yet, this represented more than a quarter (27.1%) of all logged theft crimes for the region – the highest proportion across all parts of England and Wales.
At the other end of the scale, 1,759 cases of vehicle theft were reported to British Transport Police in September 2024, representing 4.9% of total reported theft crimes to the organisation and 0.5% of all recorded vehicle theft in England and Wales.
Vehicle theft stats by county/police force
As of September 2024, 105,100 cases of vehicle theft were reported to the Metropolitan Police. This accounted for more than a quarter (28%) of all recorded thefts in England and Wales and more than a fifth (22.2%) of logged theft incidents in the capital for the year to date.
This was followed by the West Midlands, which noted 33,193 reported vehicle thefts and attributed to almost a third (30.7%) of all recorded thefts in the county – the highest proportion across all areas.
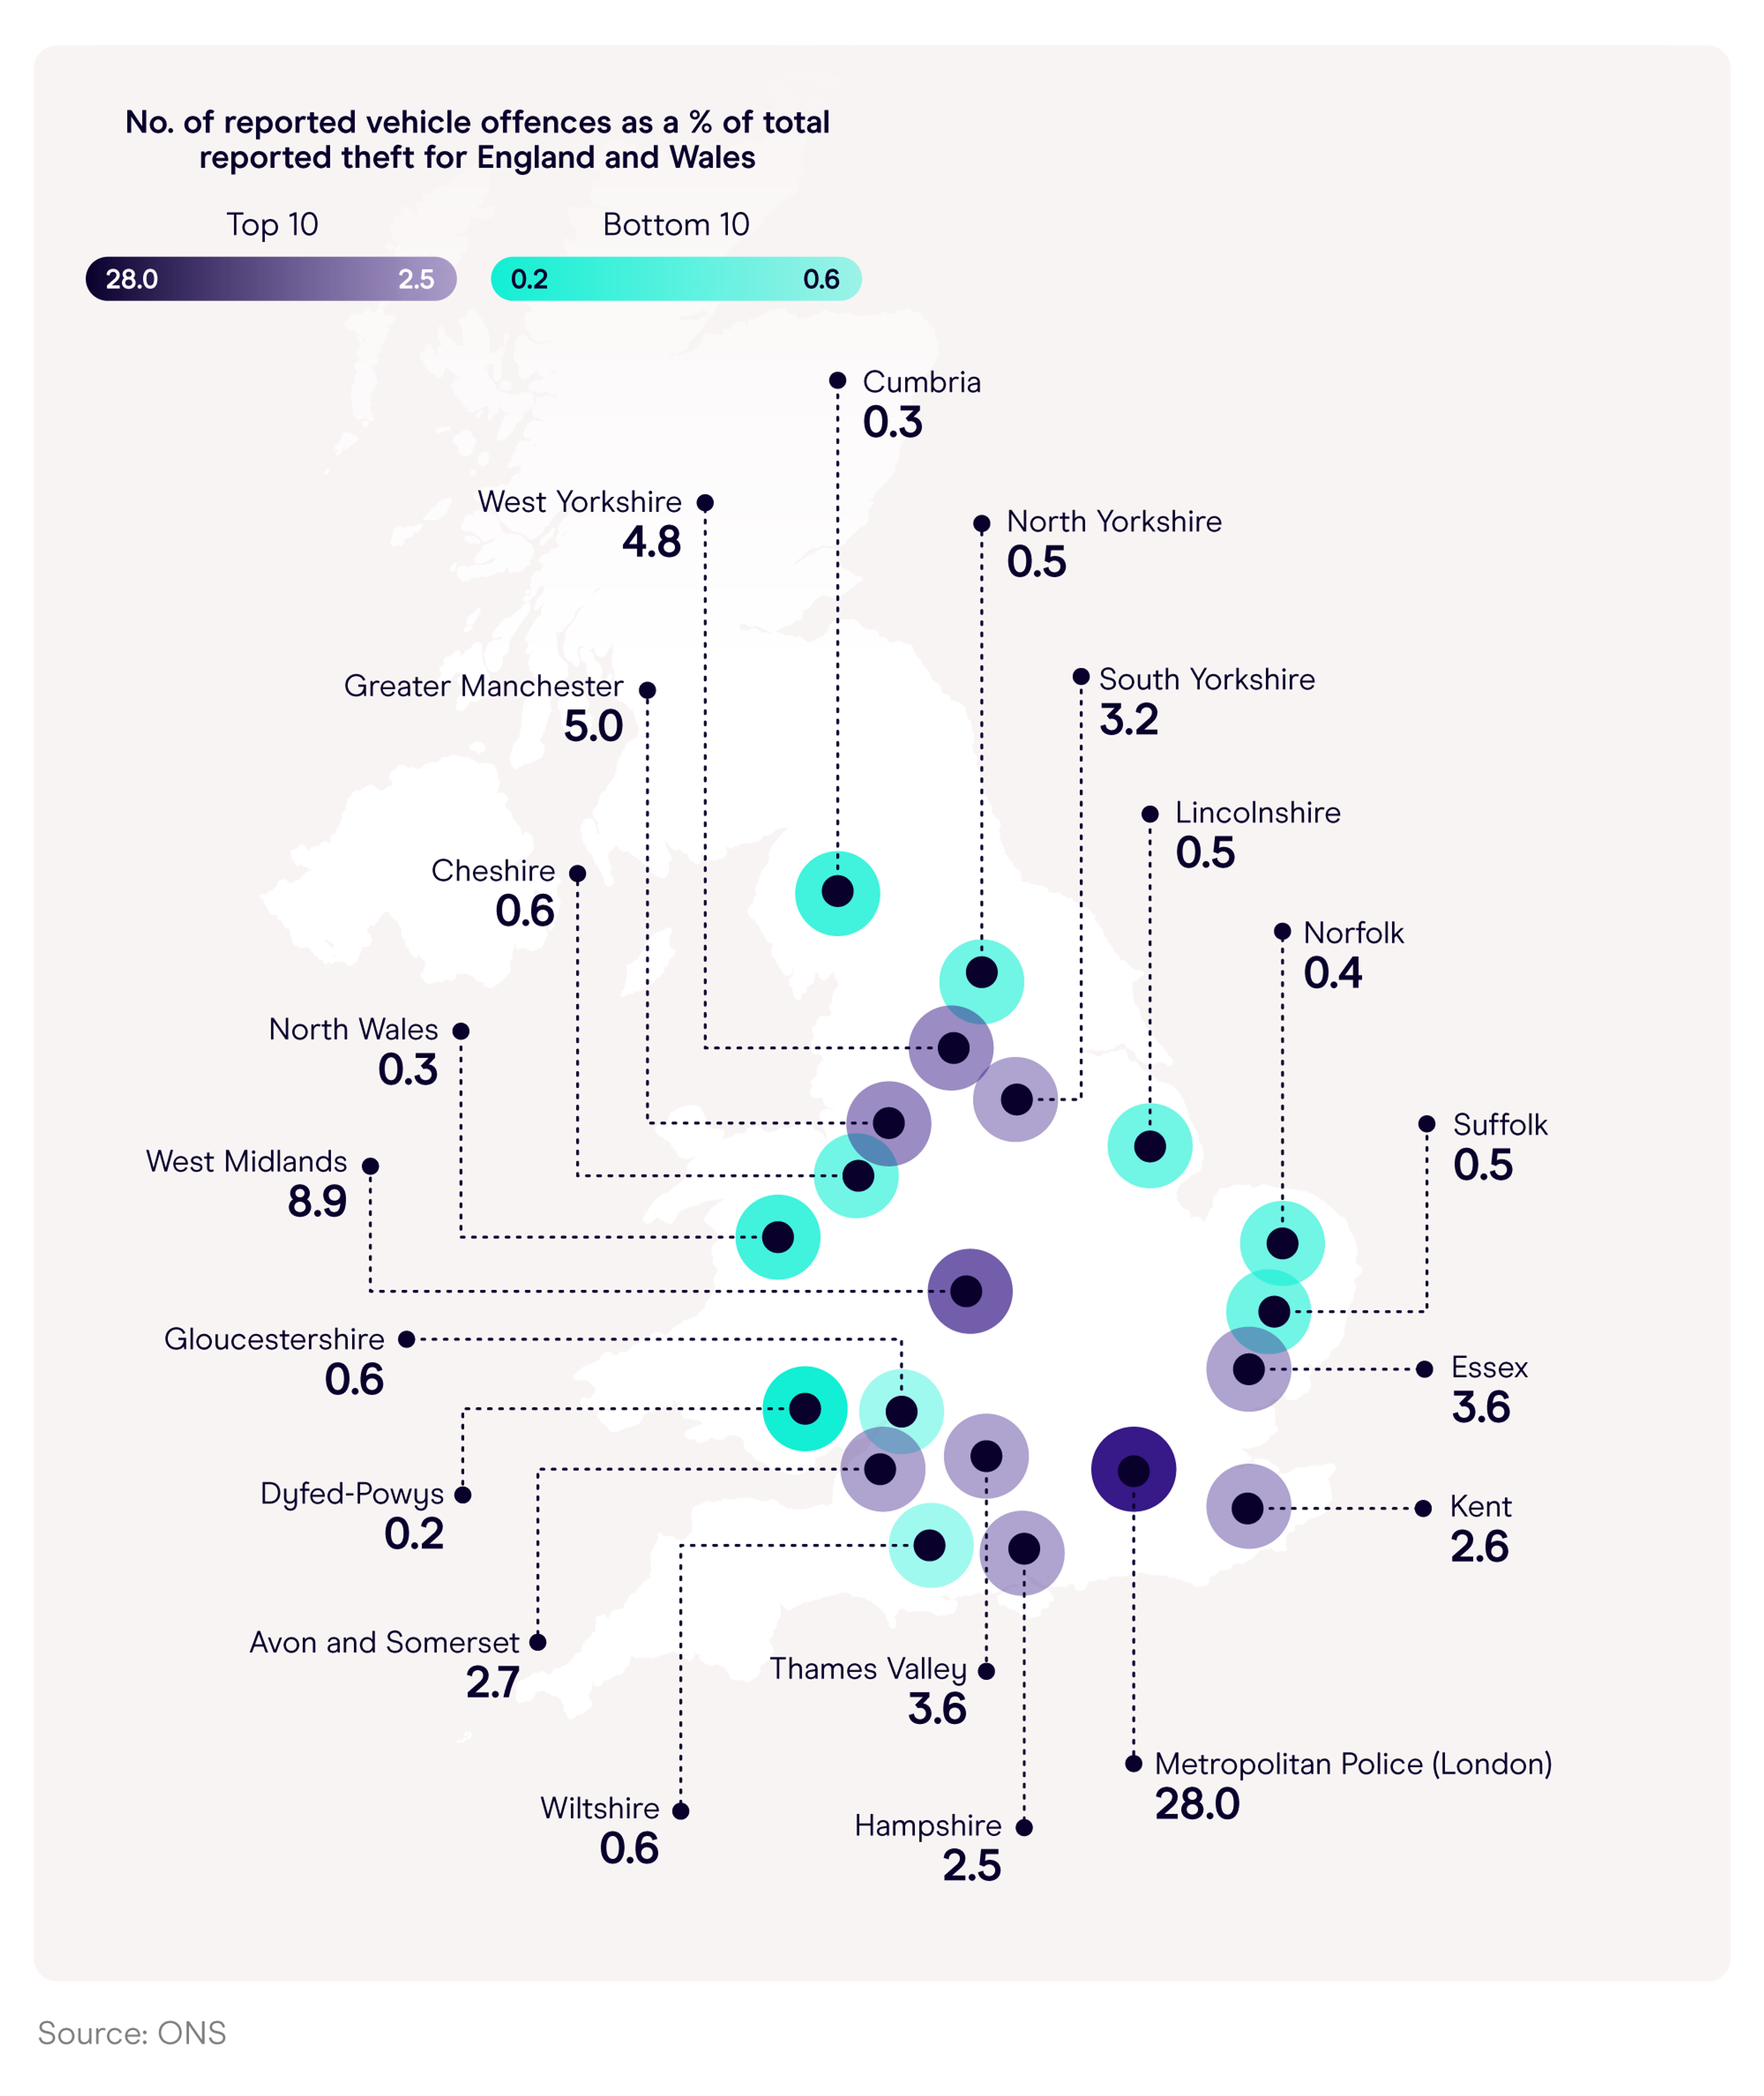
^ Areas of England and Wales with the highest and lowest amount of reported vehicle theft
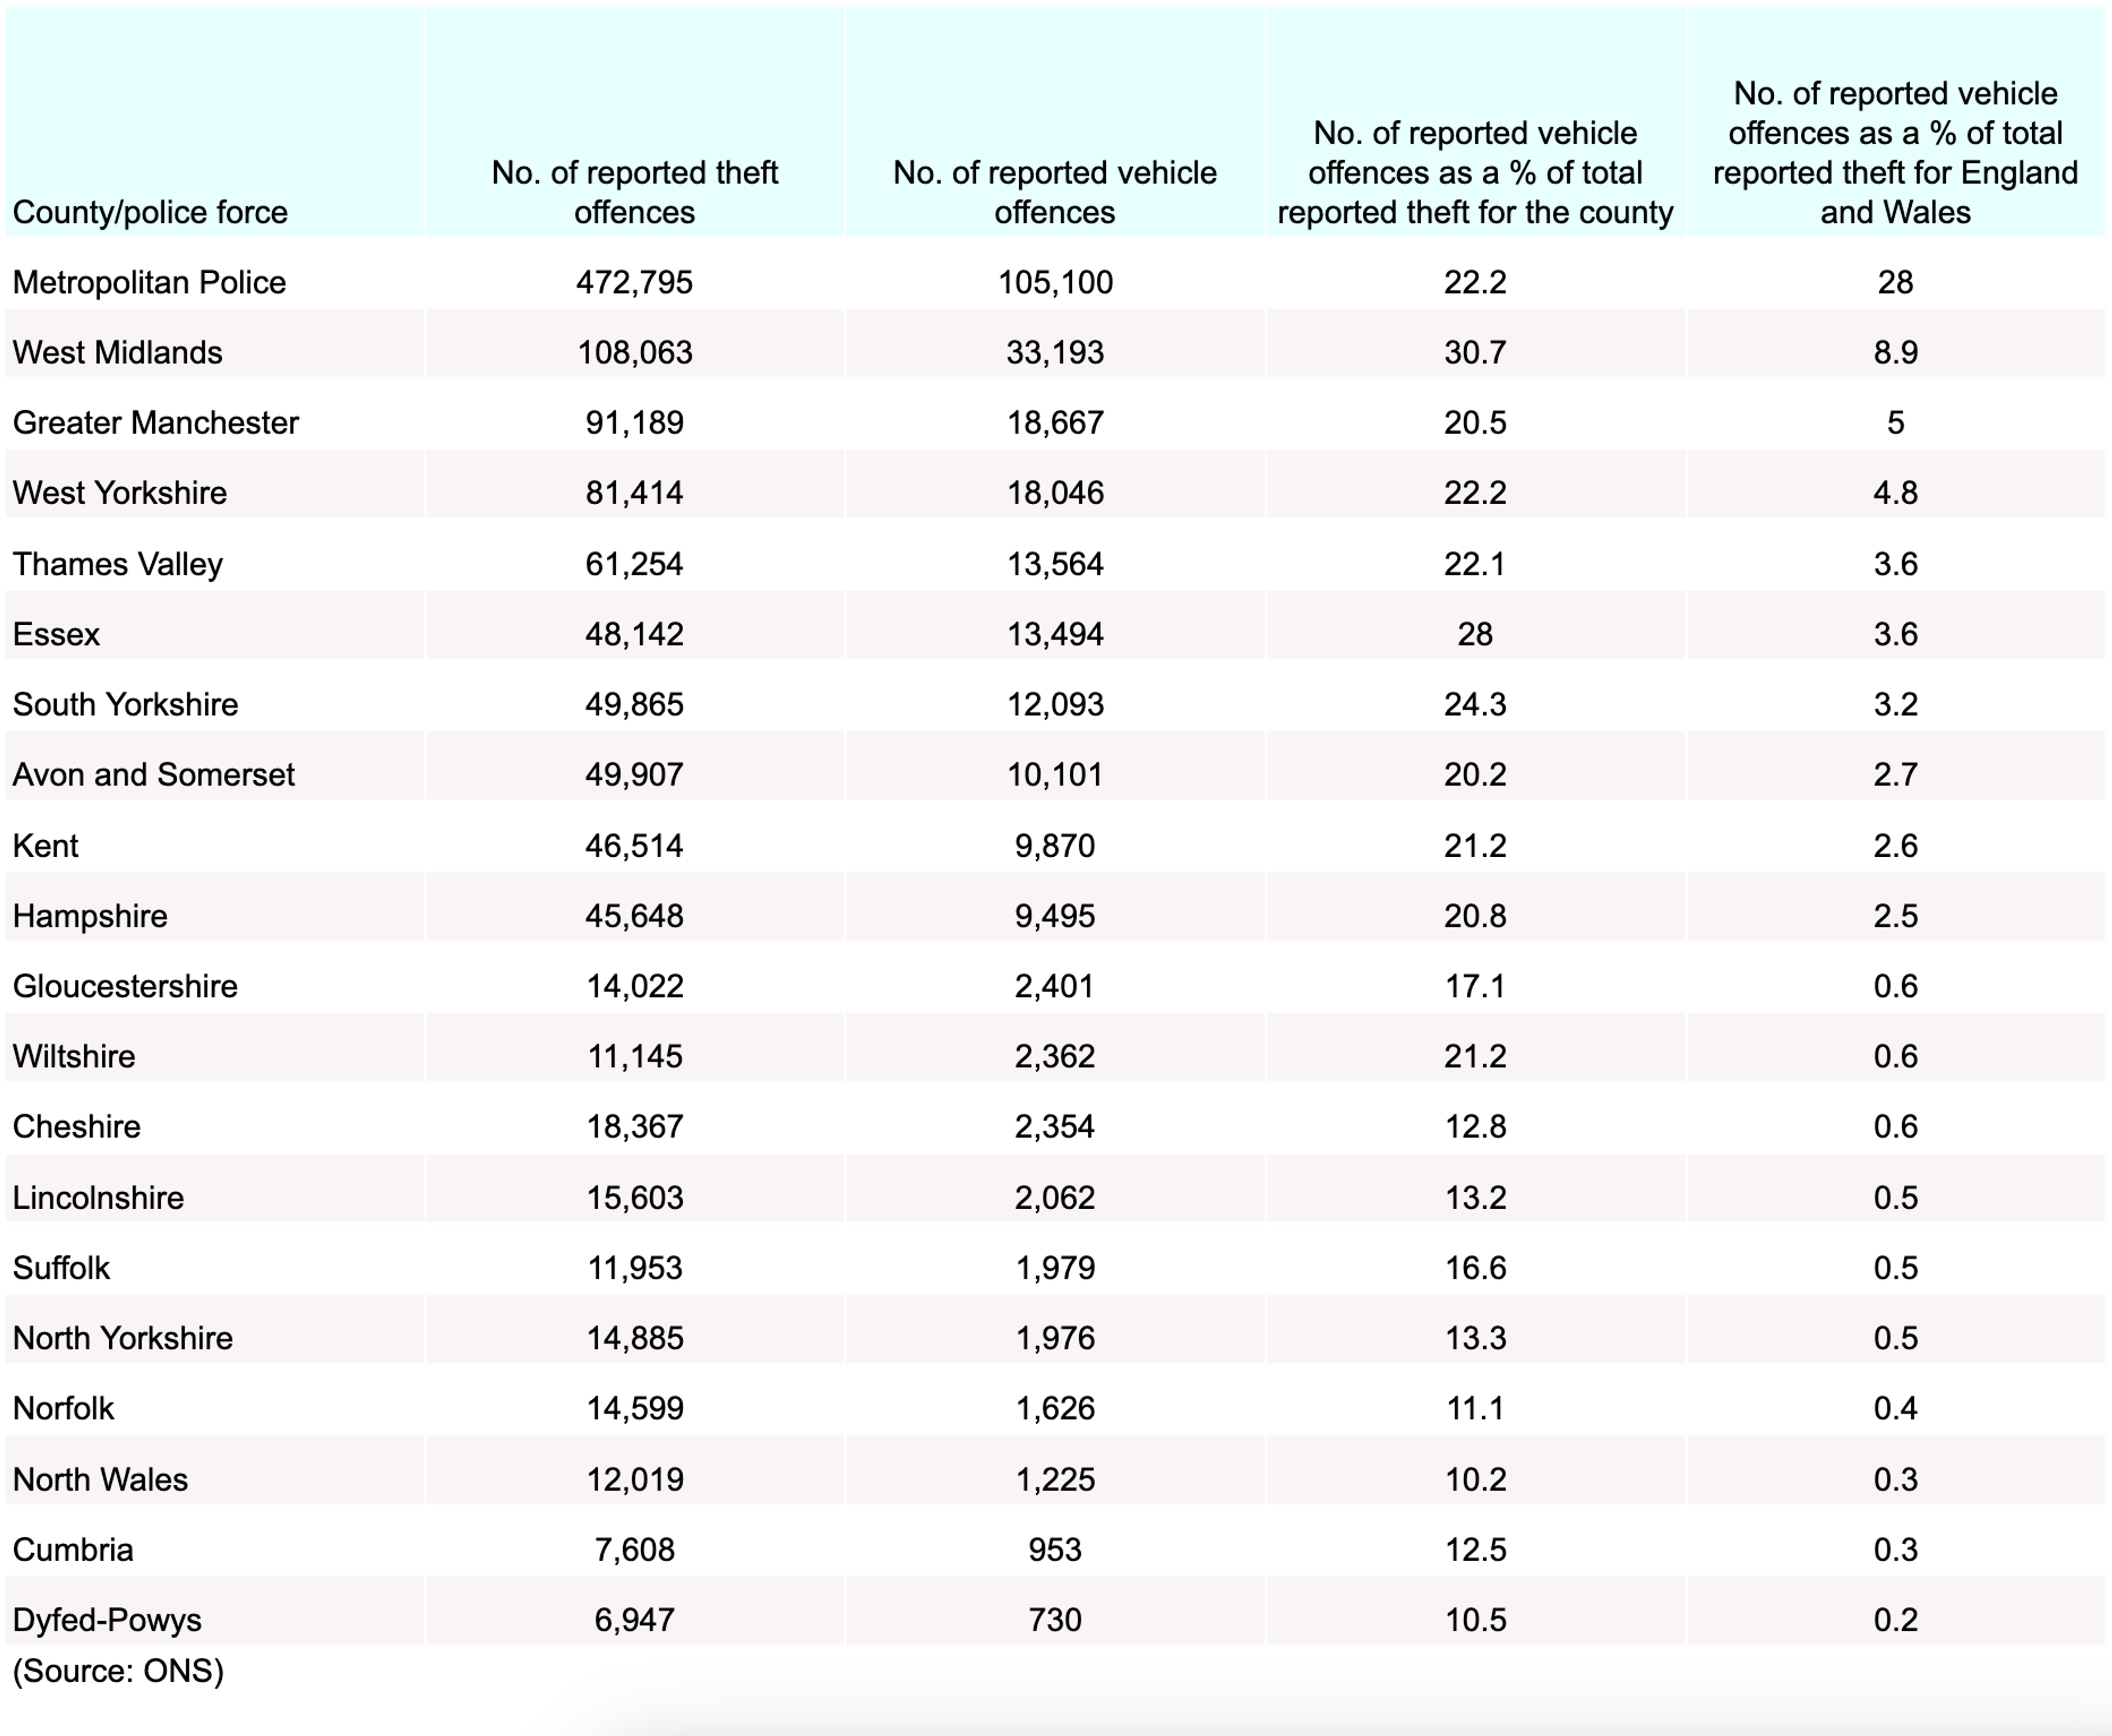
Despite Warwickshire receiving eight times fewer reports of stolen vehicles compared to the West Midlands over this period, this still represented around one in three (29.7%) thefts across the county – the second-highest proportion across all counties in England and Wales.
By contrast, Dyfed-Powys recorded just 730 vehicle thefts in the year ending September 2024, the lowest of all counties in the study. This equates to around one in ten (10.5%) reported theft crimes for the area – a figure only surpassed by North Wales (10.2%) despite receiving around 50% more reports of stolen vehicles.
Vehicle theft stats by population size
As of September 2024, London had the highest proportion of reported vehicle thefts, with 11.8 cases per 1,000 people, followed by the West Midlands (7.7).
This is perhaps unsurprising given that these are amongst the most densely populated parts of the country. However, according to estimated ONS population figures from 2023, there are around 5.6% more people in the East of England compared to London. Yet, the average number of reported vehicle thefts in this region is more than double that of the capital, at 5.1 per 1,000 residents.
Regional number of reported vehicle theft offences per 1,000 people
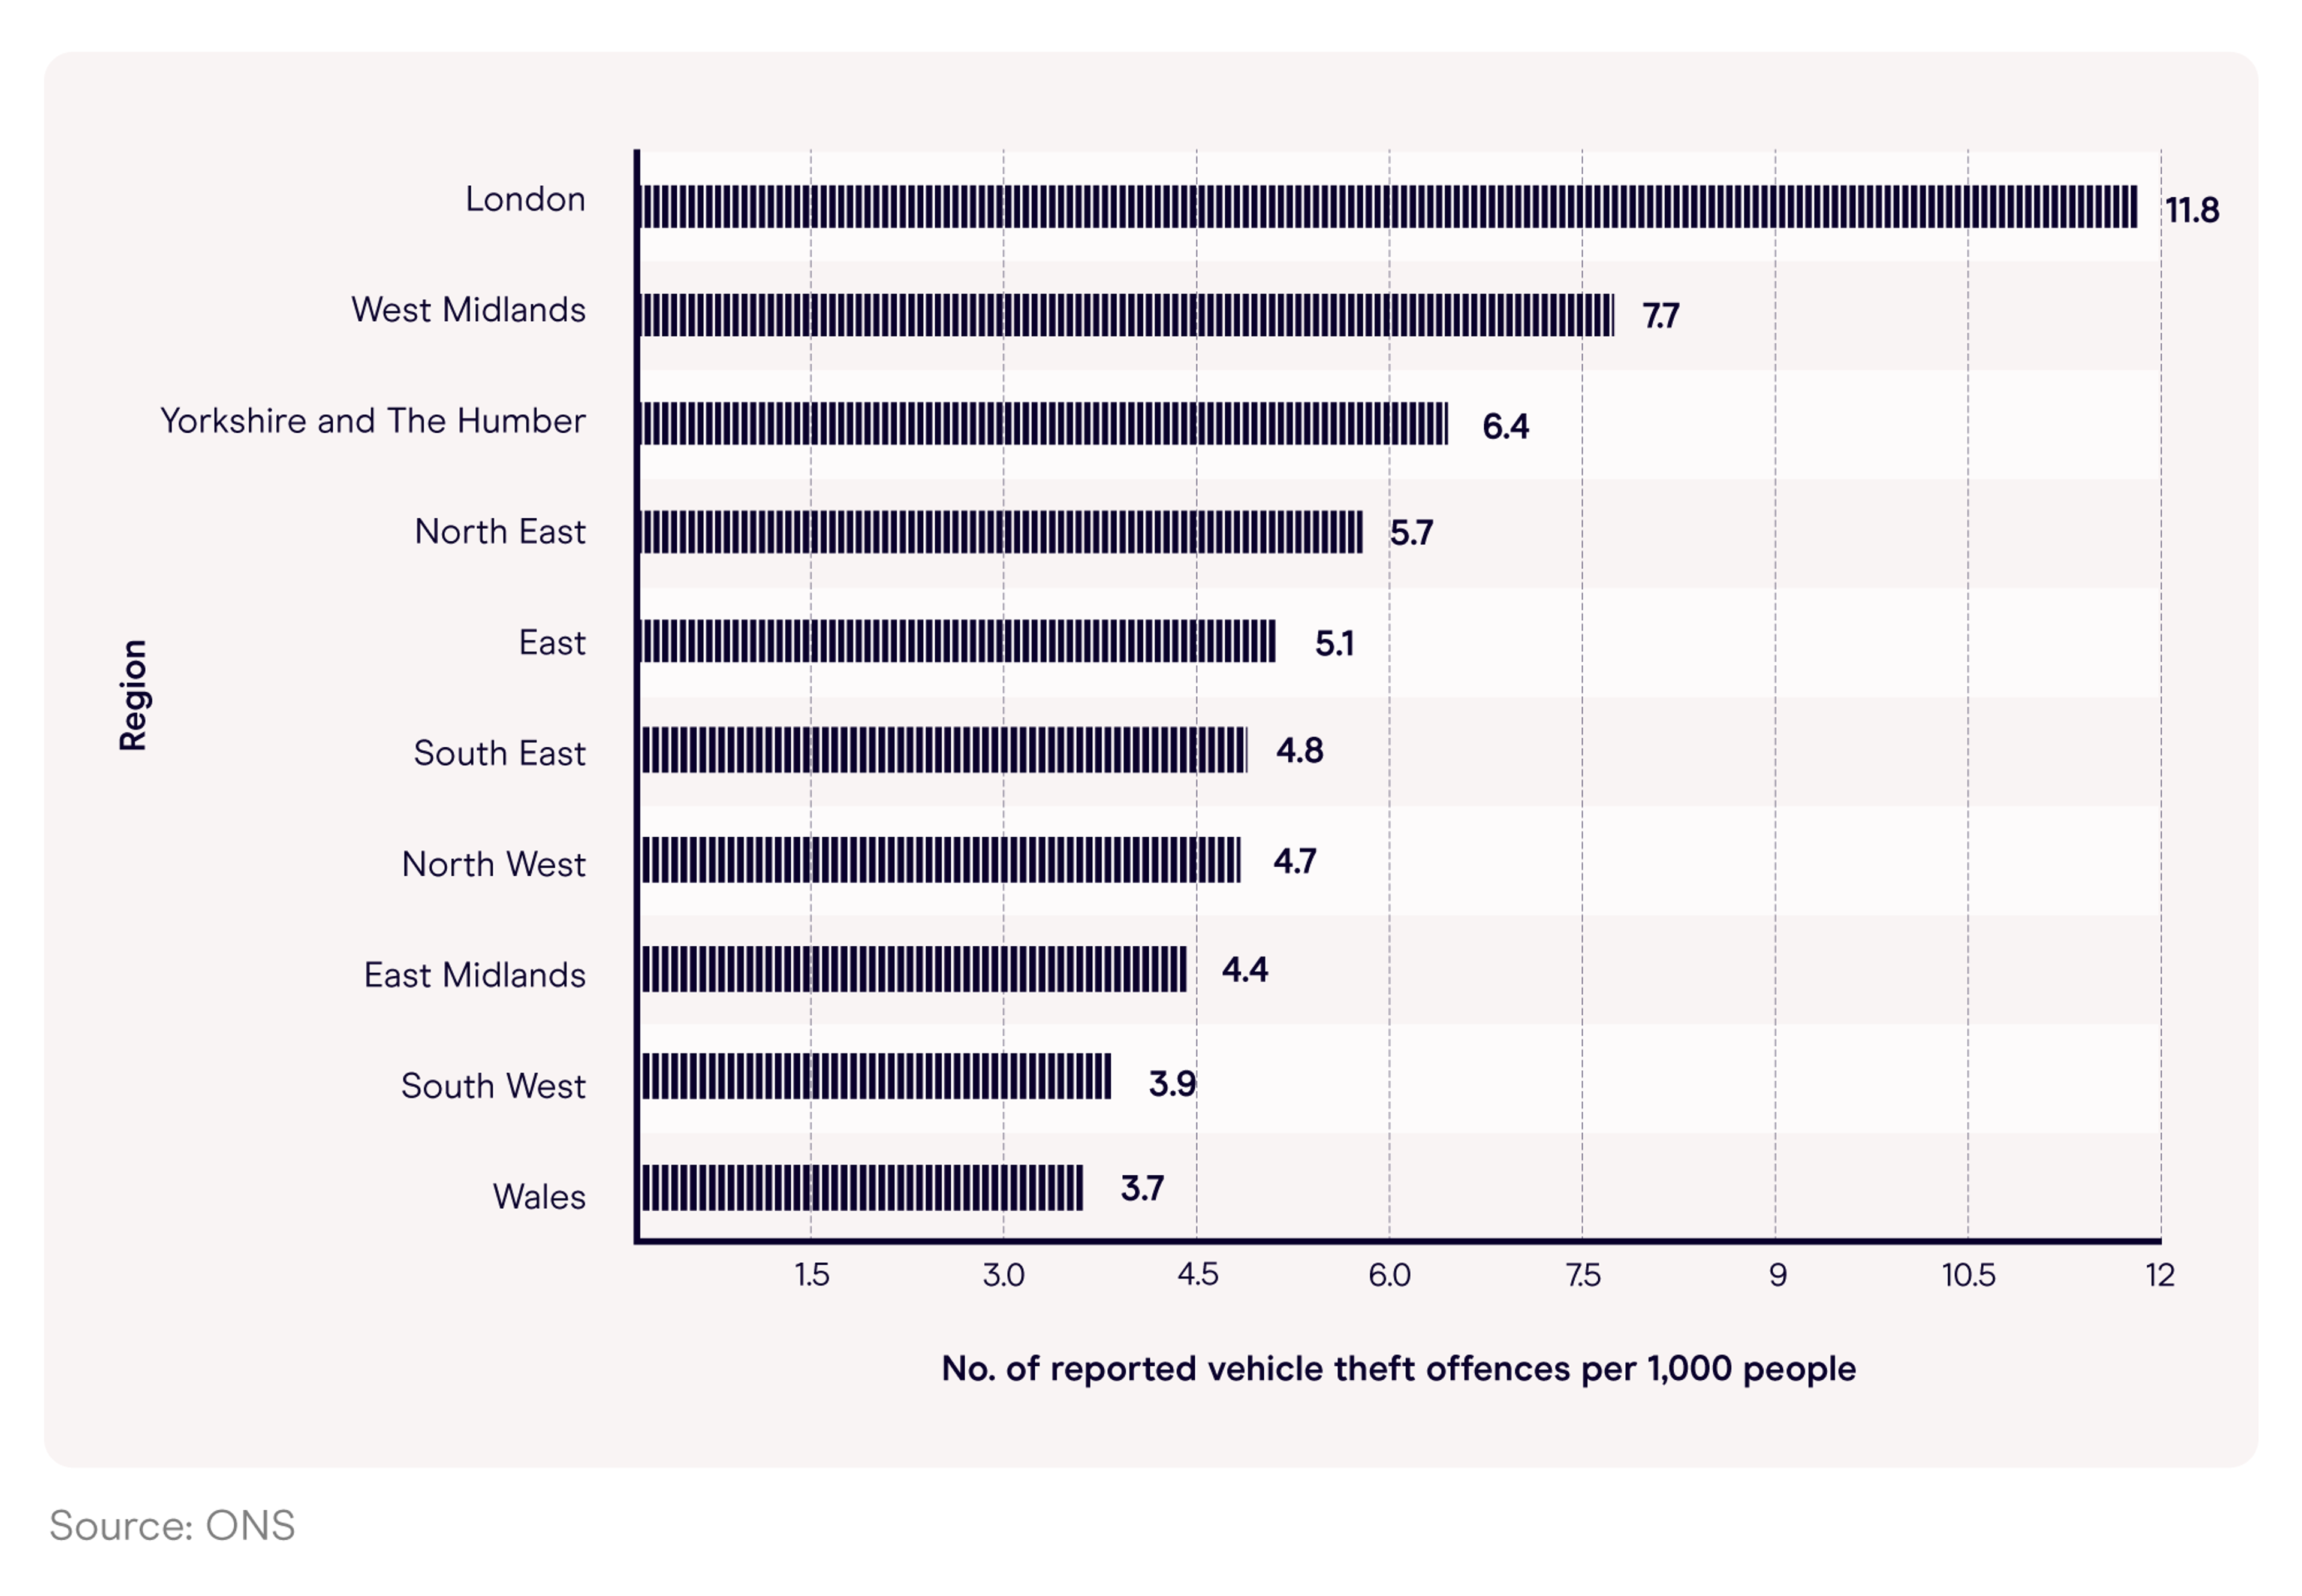
^ Regional number of reported vehicle theft offences per 1,000 people
Conversely, the rate of vehicle theft relative to its population is lowest in Wales (3.7 per 1,000 people) despite not having the smallest population.
ONS estimates from 2023 suggest around 2.7 million people live in the North East of England. Yet, when averaged out, this results in a rate of 5.7 reported vehicle thefts per 1,000 inhabitants – almost double that of Wales despite having around a sixth (15.4%) fewer people.
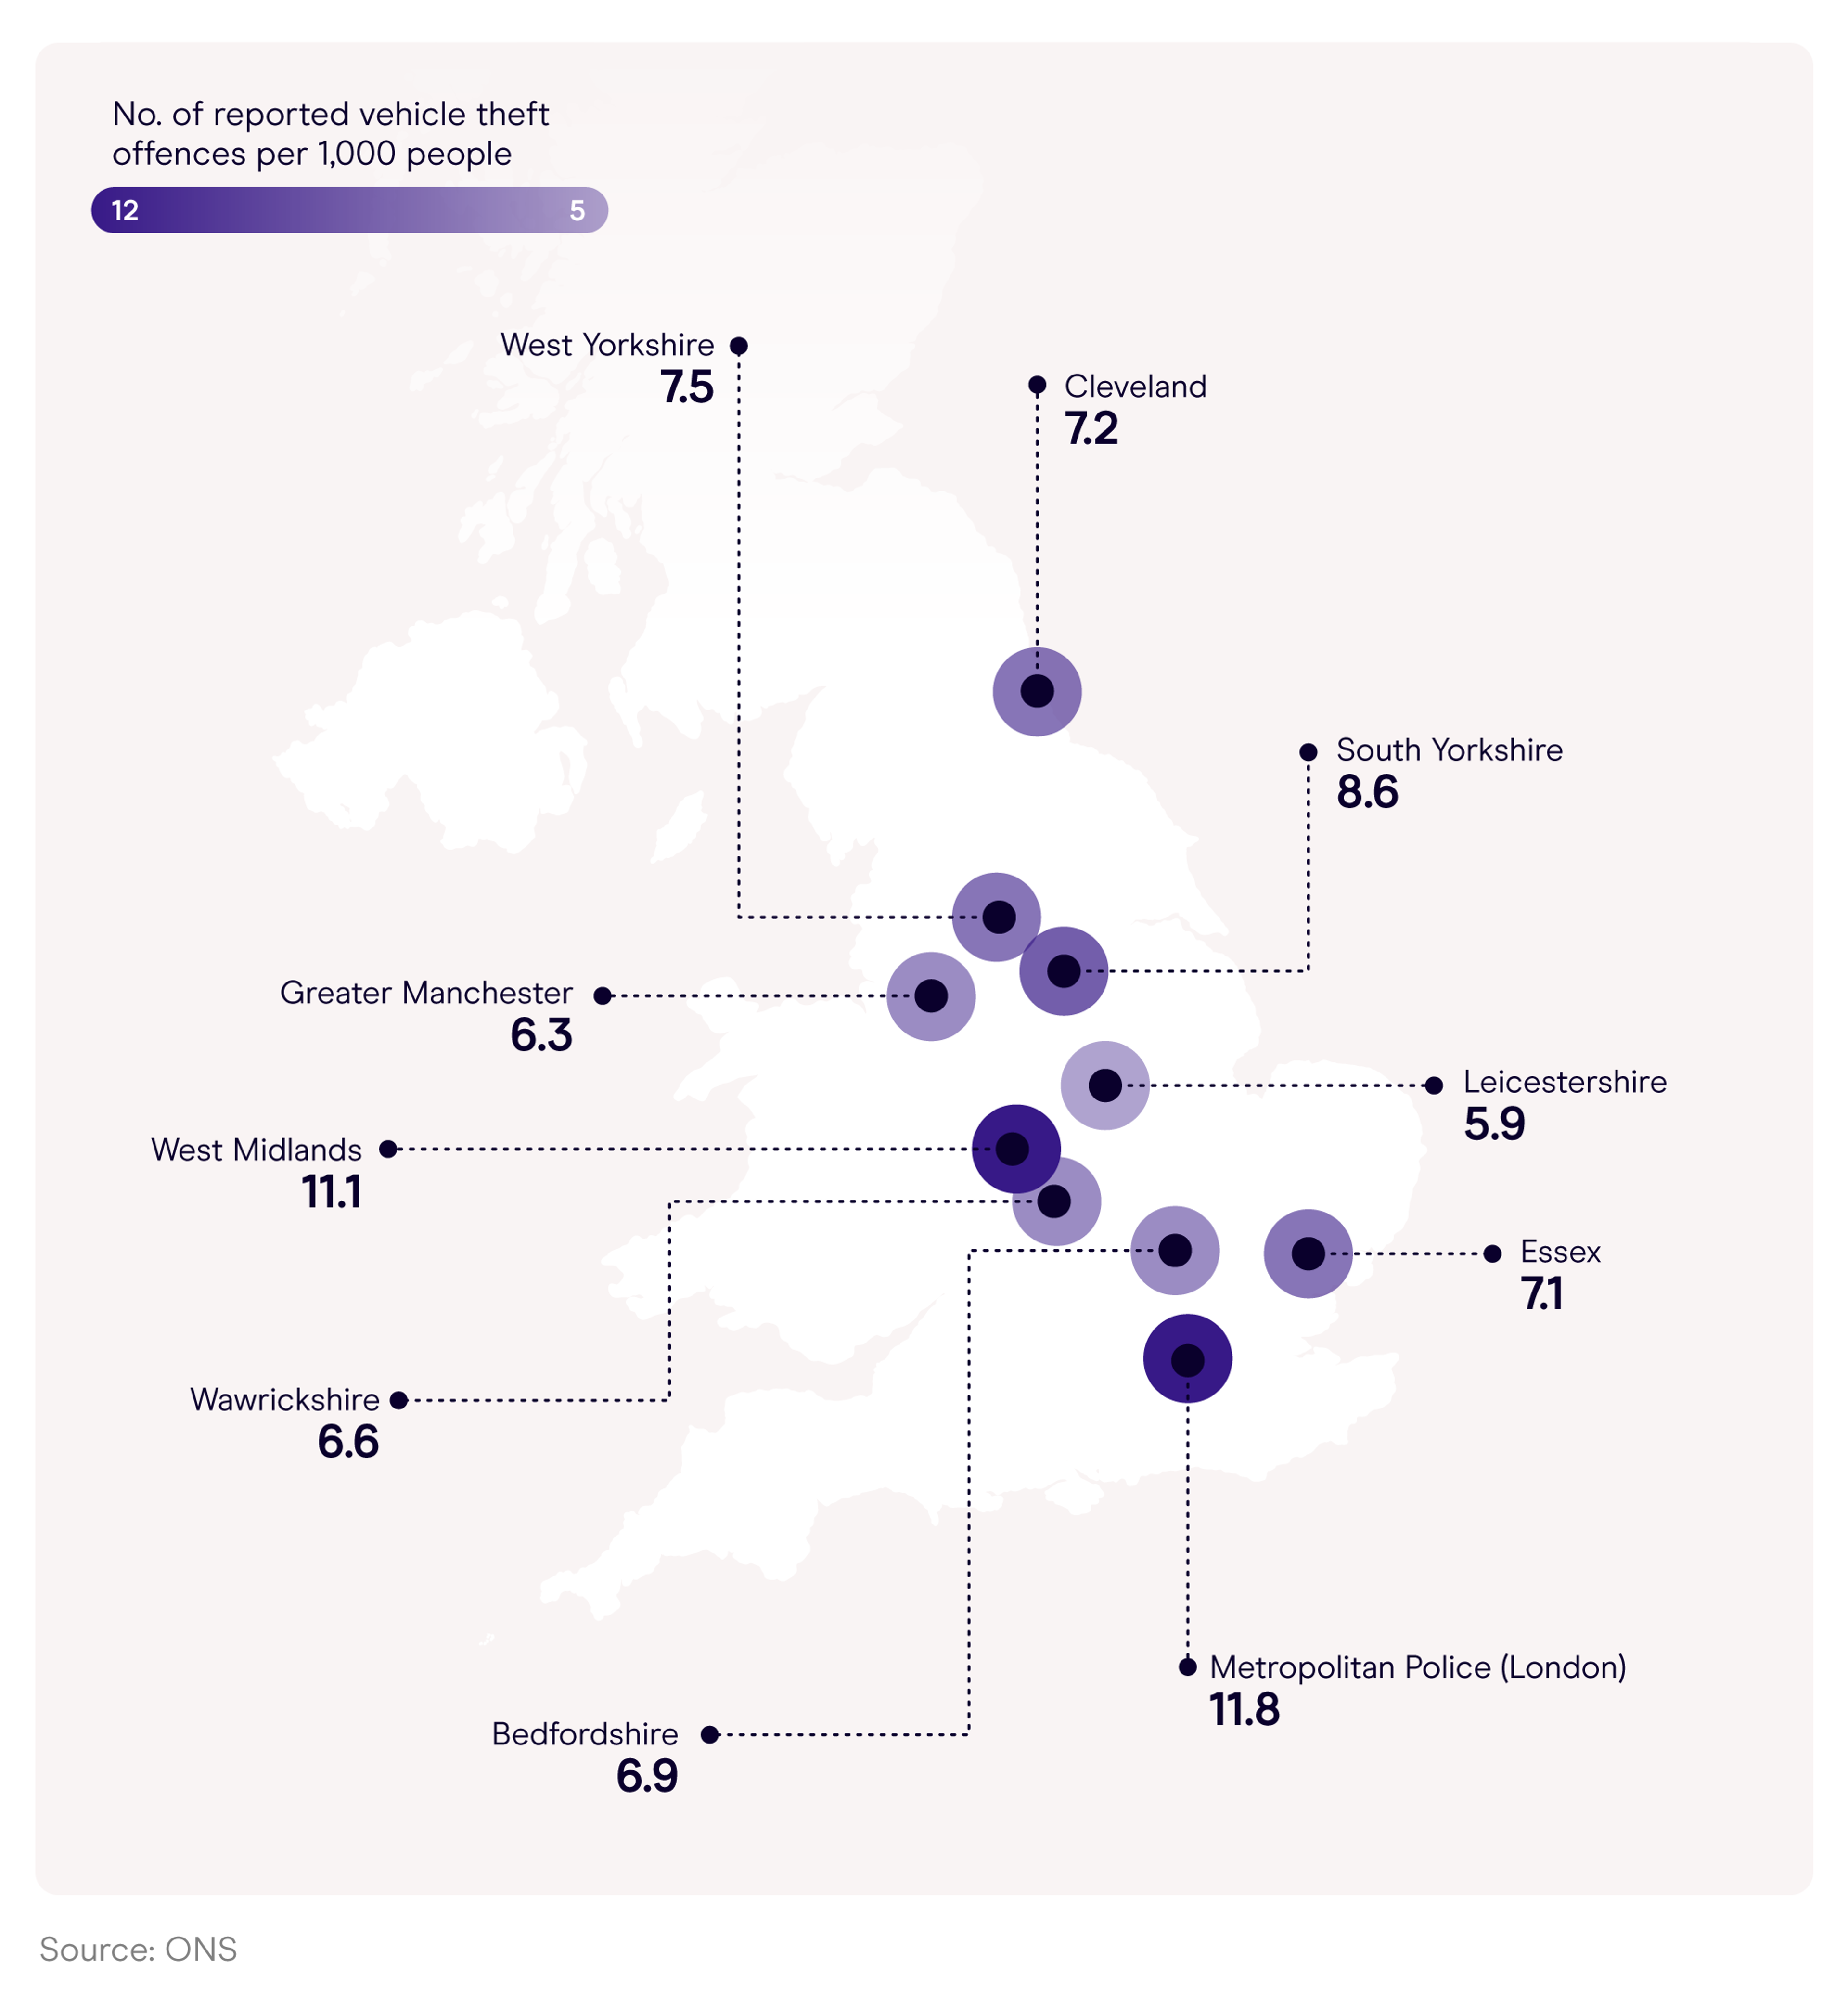
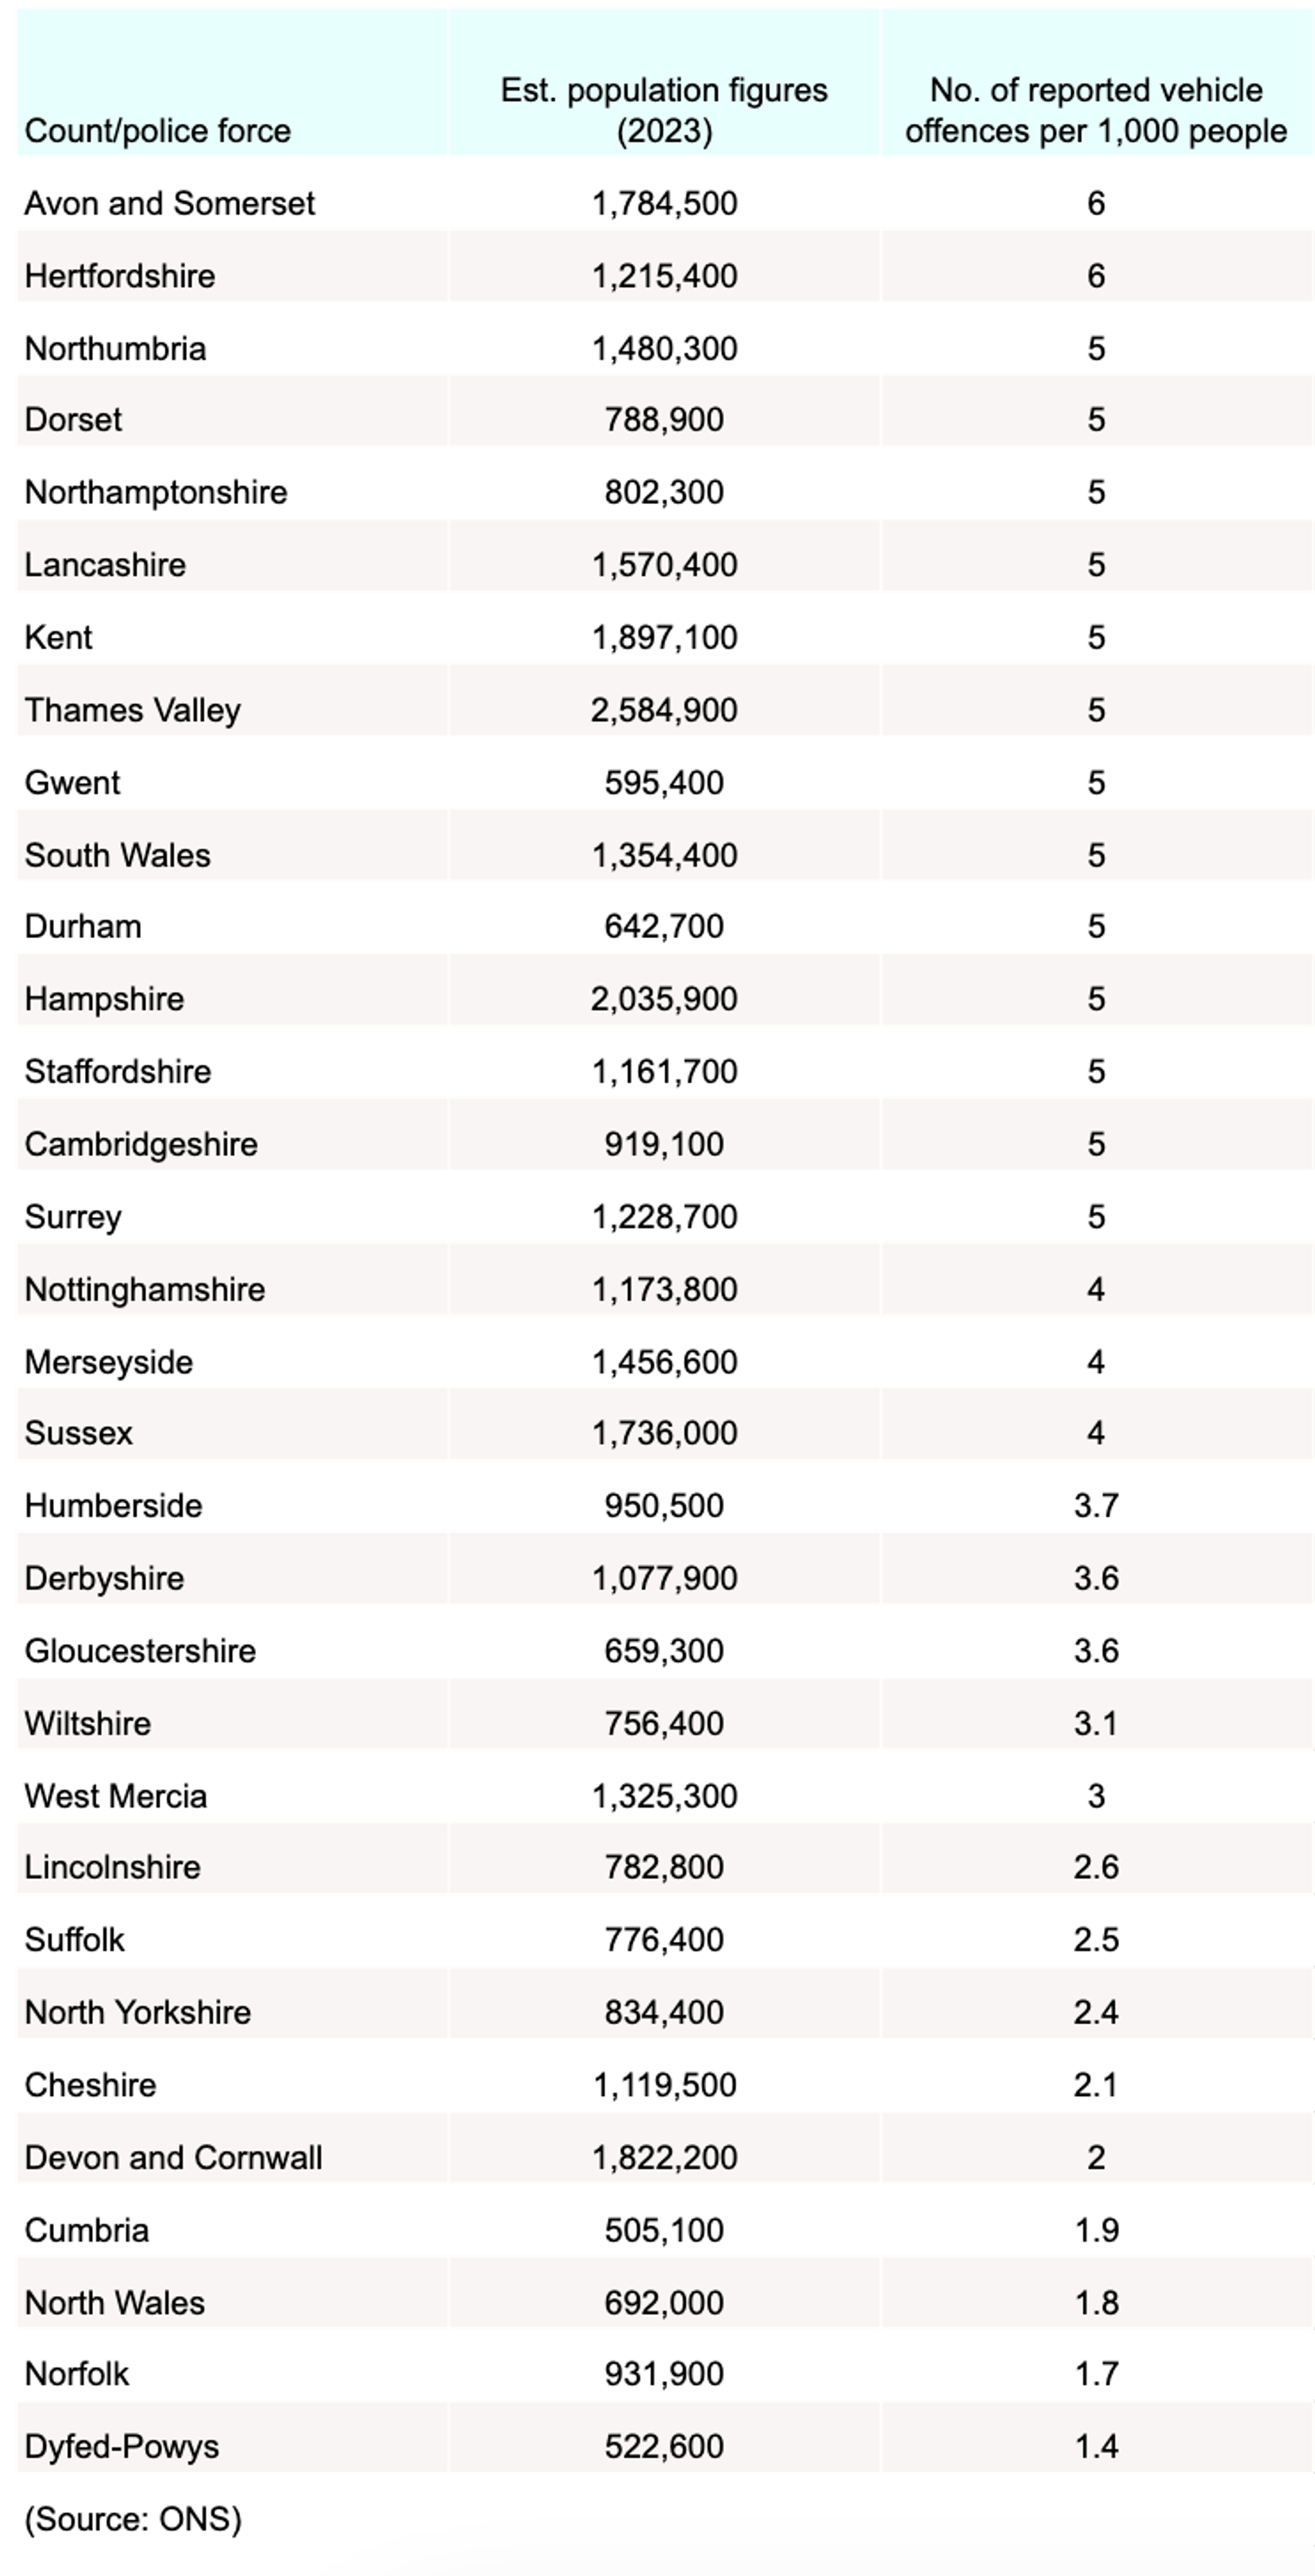
^ Number of reported vehicle theft offences per 1,000 people by county/police force
According to the most recent ONS vehicle theft statistics, the Metropolitan Police experiences the highest rate of reported vehicle theft, with 11.8 recorded cases per 1,000 people. This is followed by the West Midlands (11.1), despite having three times fewer people by comparison.
South Yorkshire, in third, has a reported vehicle theft rate of 8.6 per 1,000 residents – notwithstanding a population around 50% smaller than West Yorkshire, which experienced 7.5 recorded vehicles stolen per 1,000 people in the year ending September 2024.
Alternatively, the lowest rates of vehicle theft across all counties of England and Wales were recorded in Dyfed-Powys (1.4 per 1,000), followed by Norfolk (1.7 per 1,000).
London car theft statistics
Reported car crime statistics from the DVLA indicate that Enfield had the highest rate of stolen cars in 2023-24. With 534 recorded vehicle thefts throughout the year, this equated to 1.62 per 1,000 people.
Following closely behind were Barking & Dagenham (1.41 per 1,000 residents) and Haringey (1.31 per 1,000 residents).
Most common London boroughs for car thefts per 1,000 people
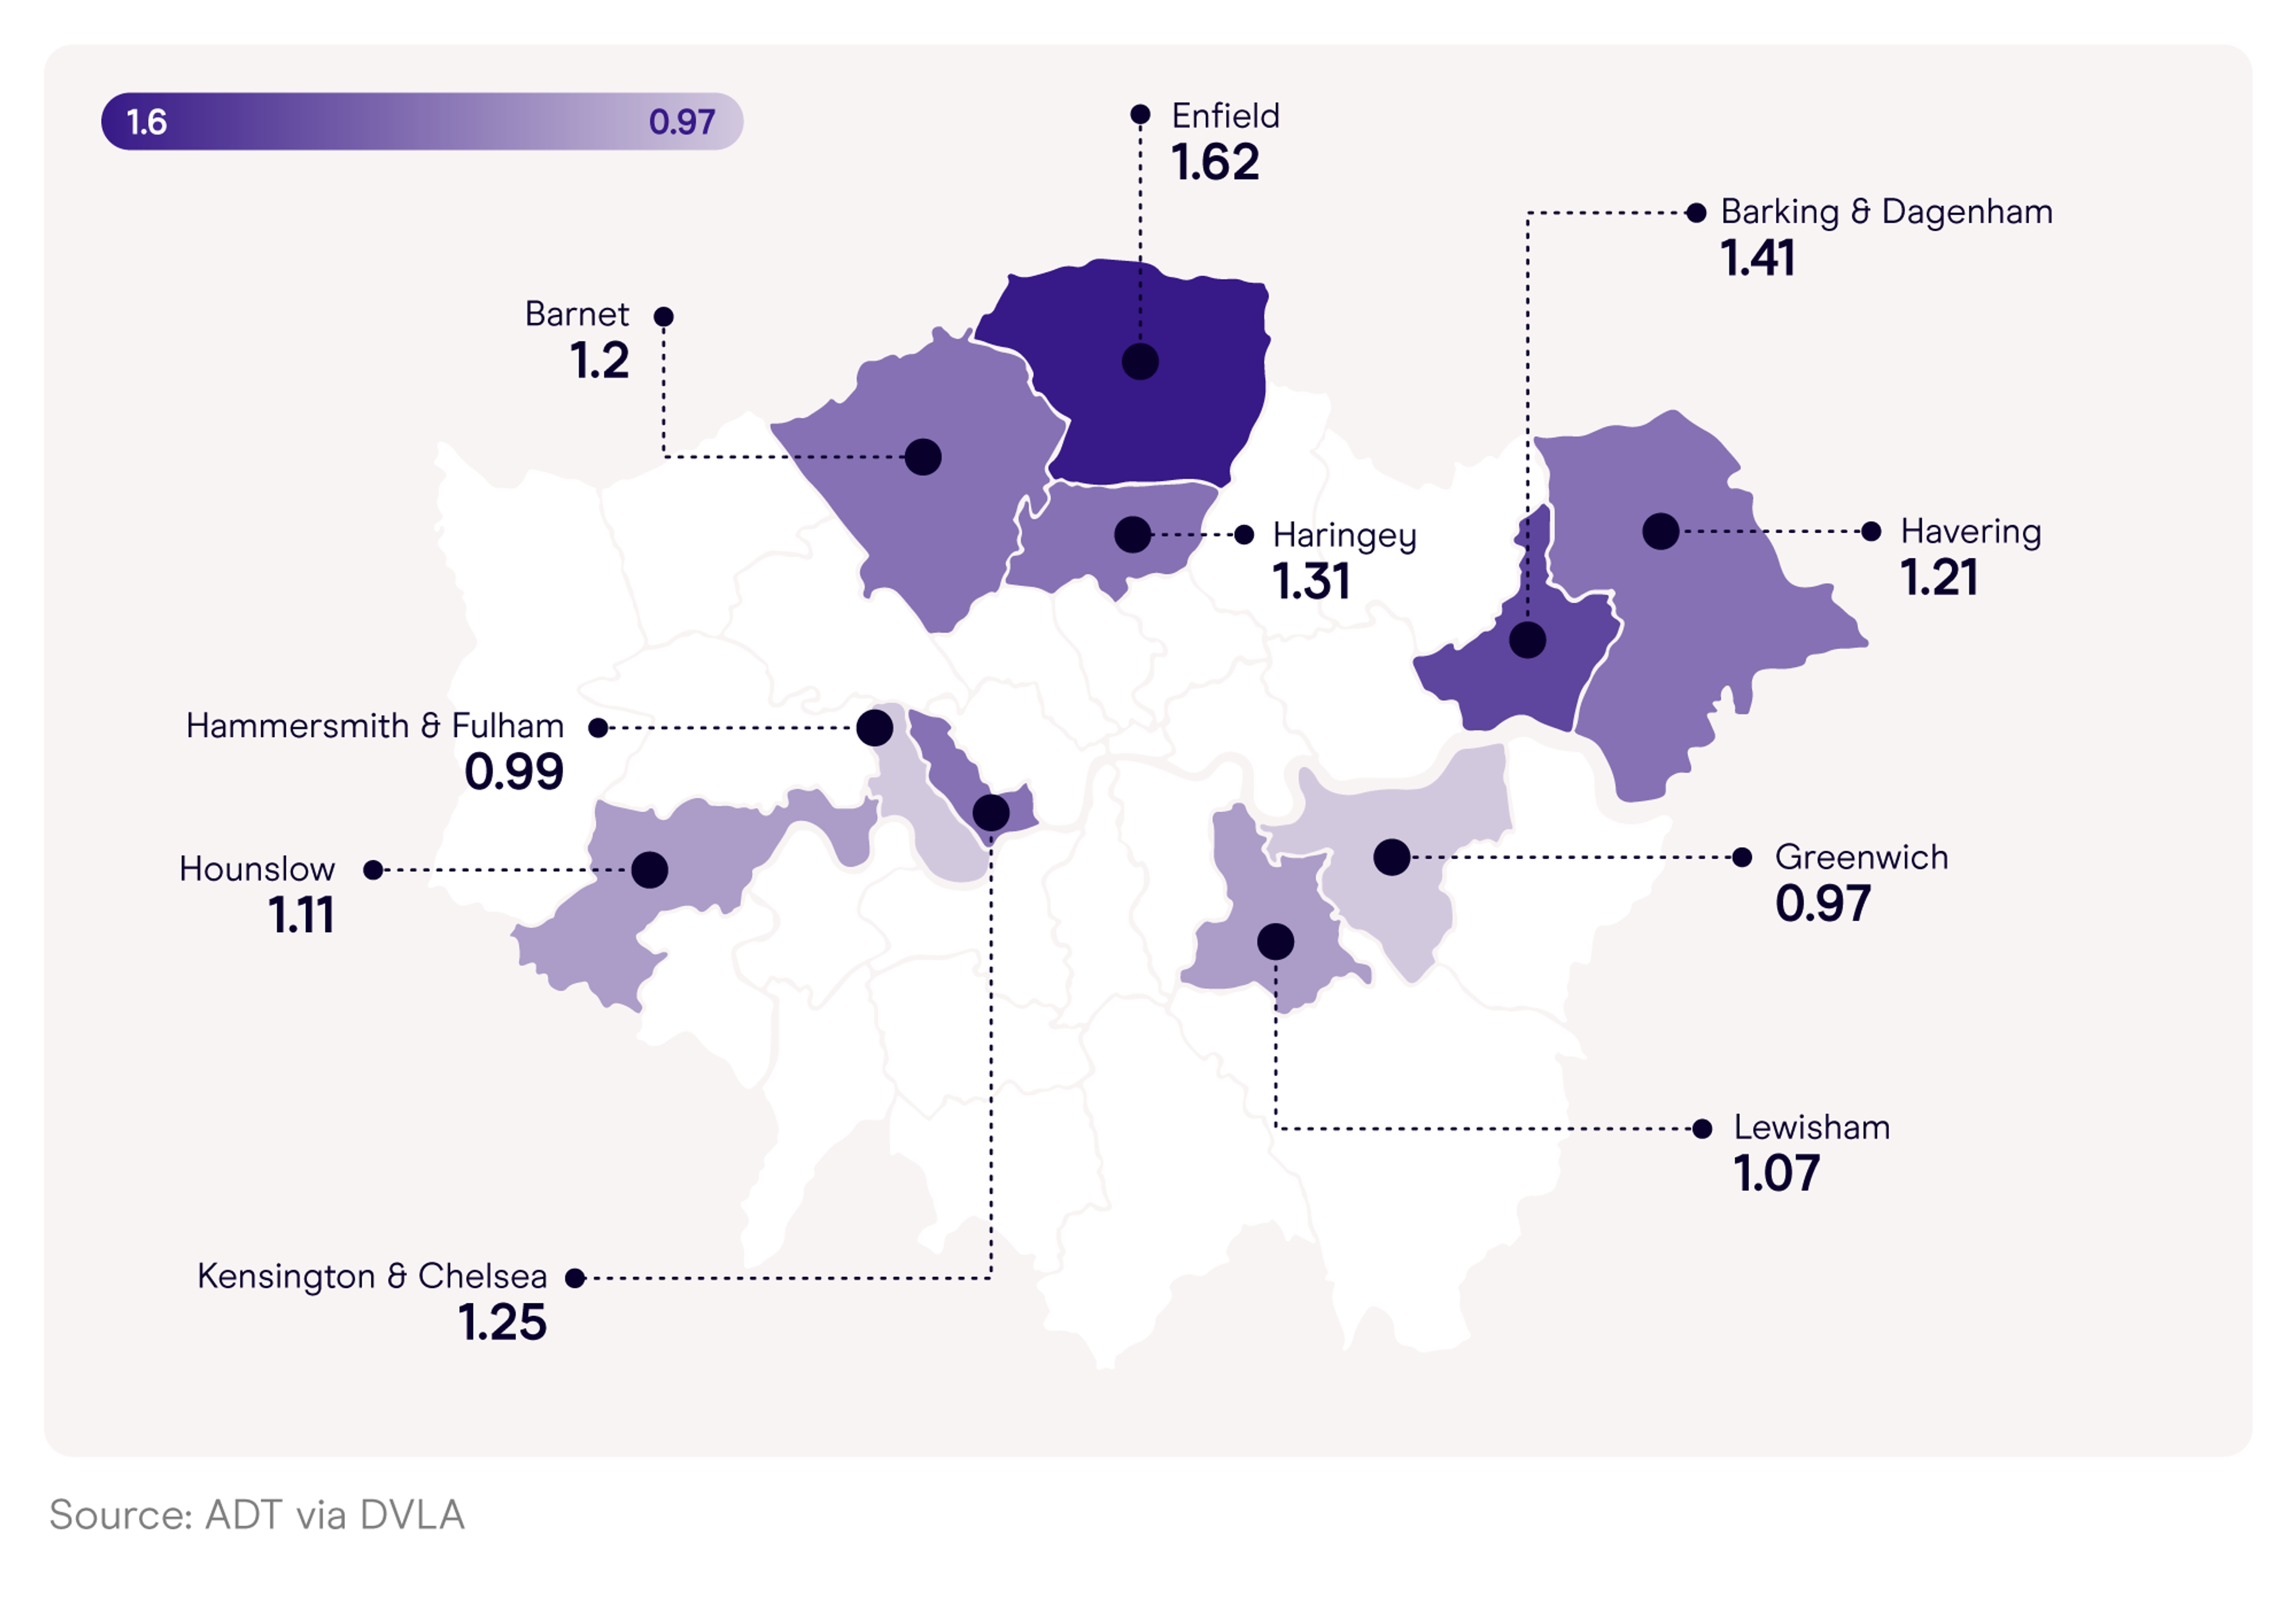
^ Most common London boroughs for car thefts per 1,000 people
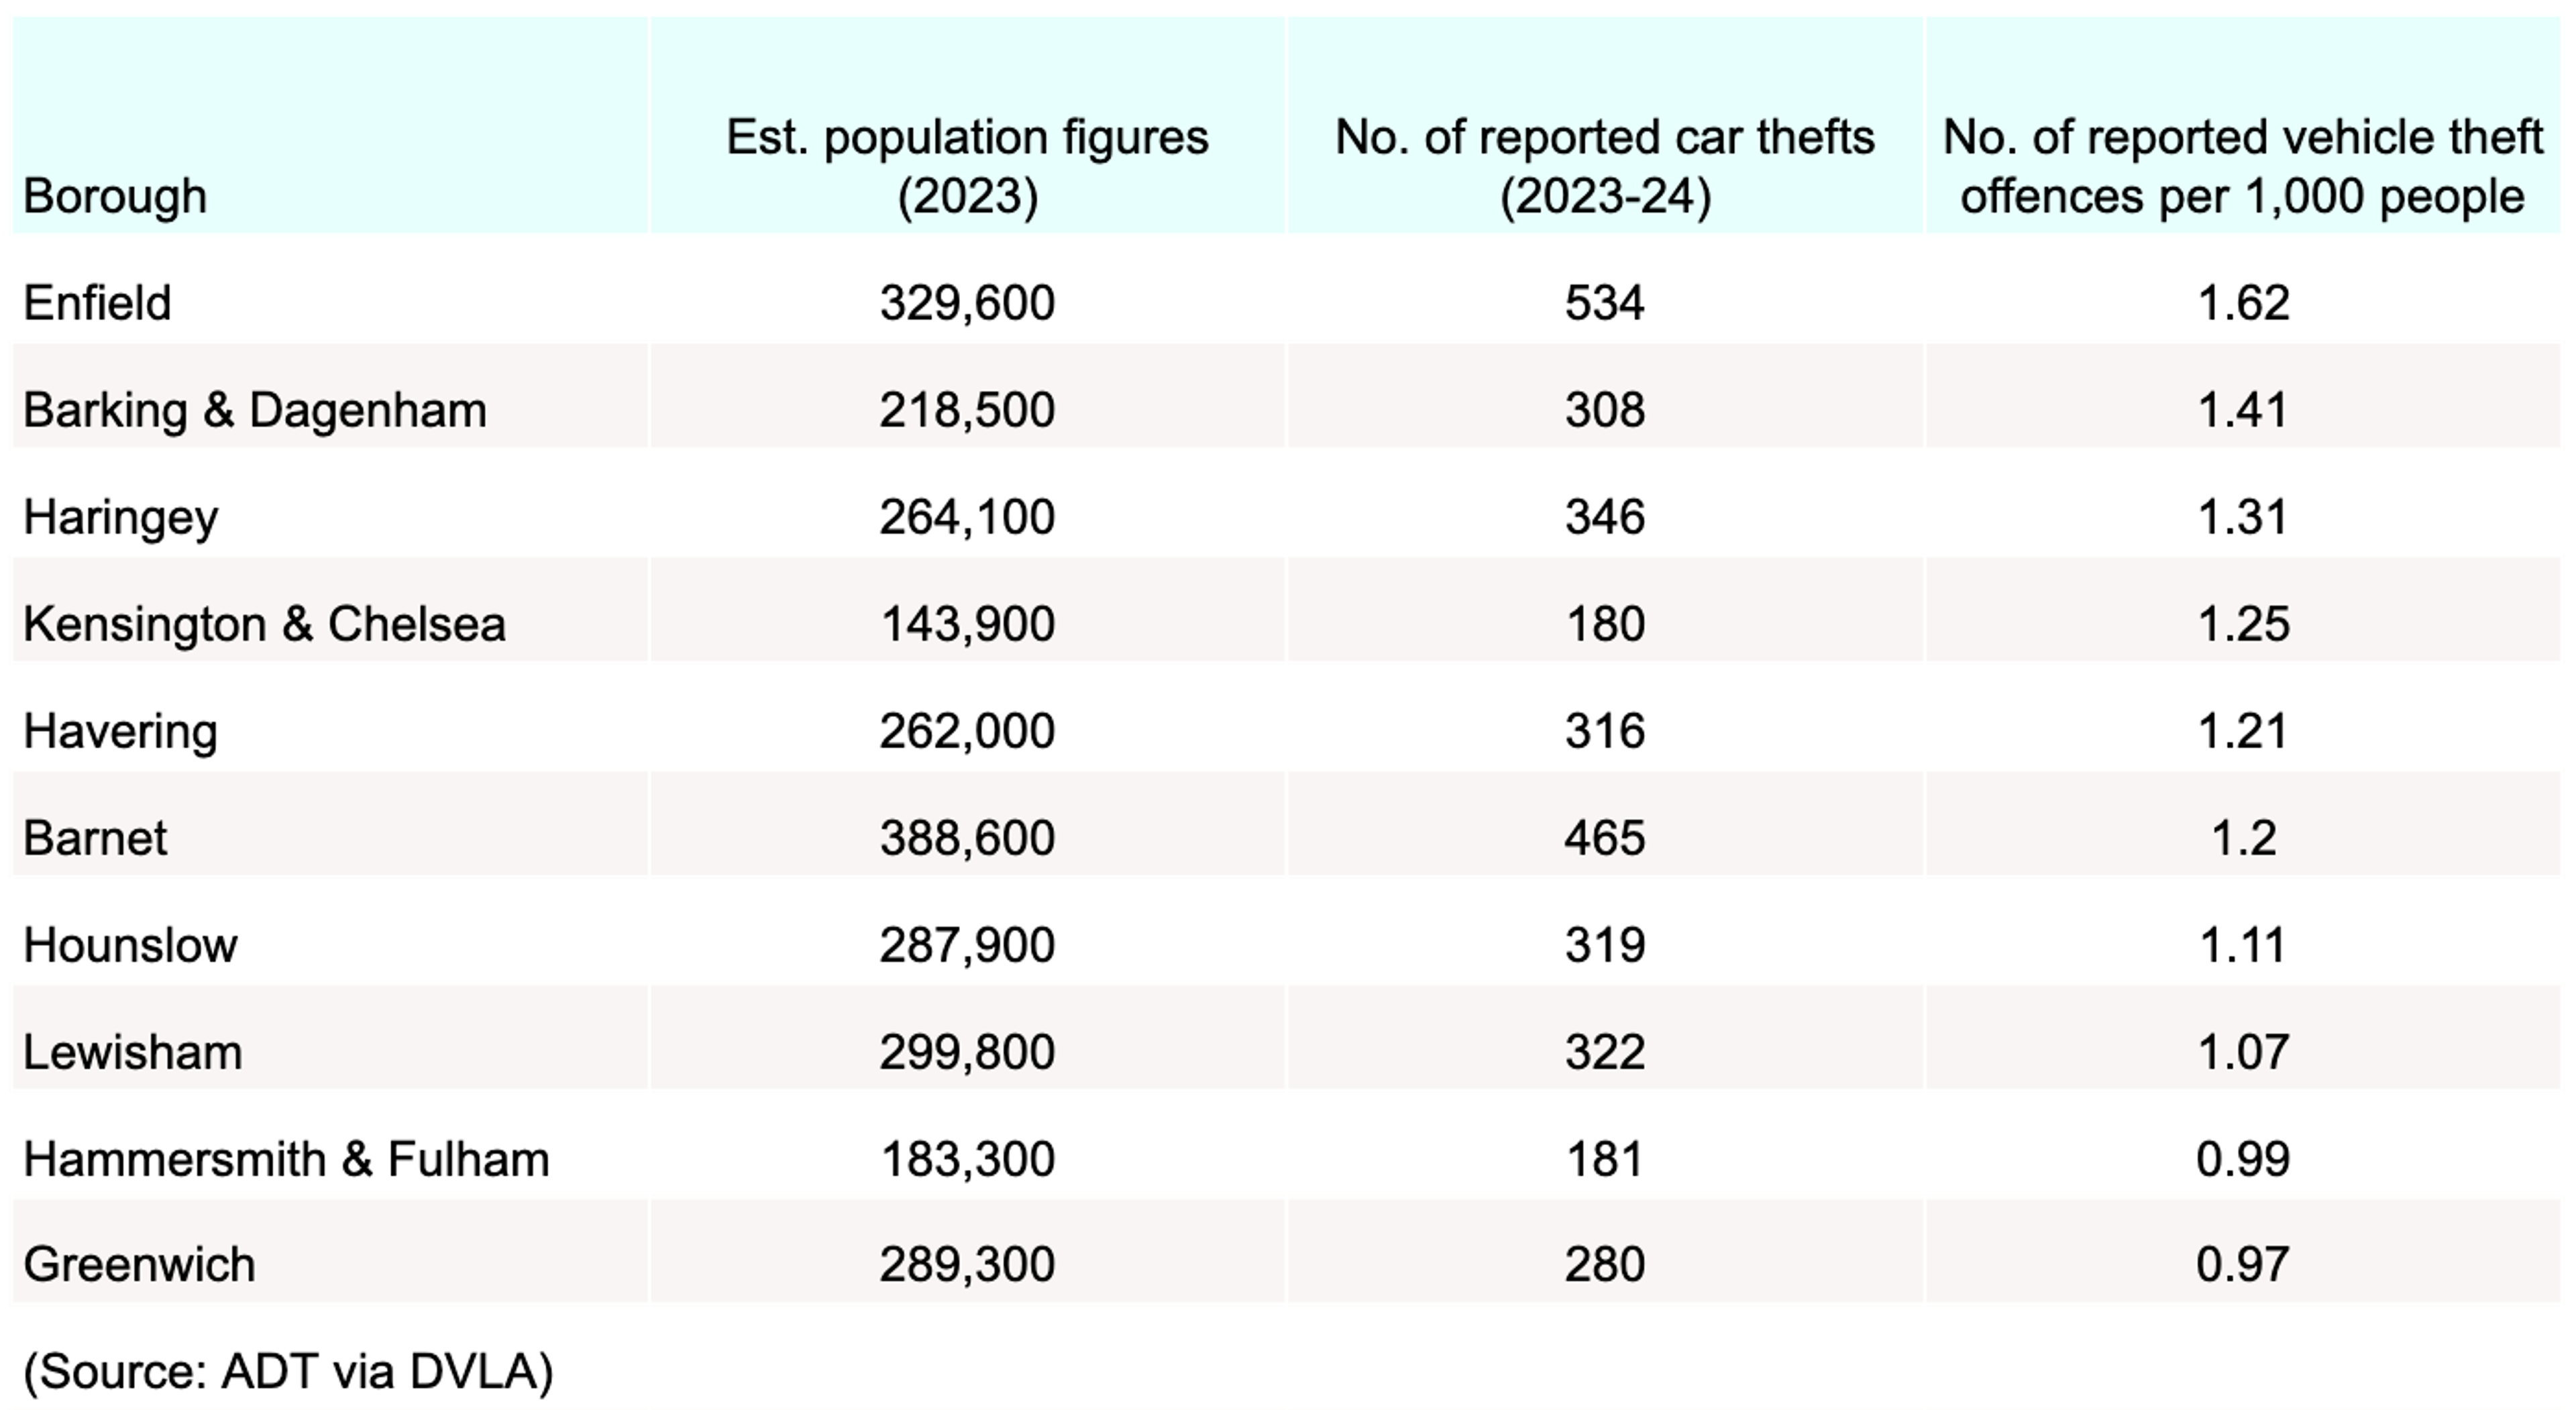
Although registering the second-highest number of reported car thefts in 2023-24 (465), Barnet comes out in sixth position, with a car theft rate of 1.20 per 1,000 inhabitants.
Hammersmith & Fulham and Kensington & Chelsea (both in west London) recorded a similar number of car thefts in 2023-24. Yet, with almost a quarter more people (24.1%), the former resulted in an average theft rate of 0.99 per 1,000 people – beaten only by Greenwich (0.97) in the top 10 despite recording 100 fewer car thefts across the year.
Most common locations for vehicle thefts
As of April 2022 - March 2023, almost two-fifths (38%) of vehicle thefts in England and Wales were reported stolen from a semi-private home, with a similar percentage (37%) from the street at home.
These trends have largely prevailed over the previous decade, reaching a peak of 41% in 2018-19 for those stolen from a semi-private home and 42% for a home street in 2016-17.
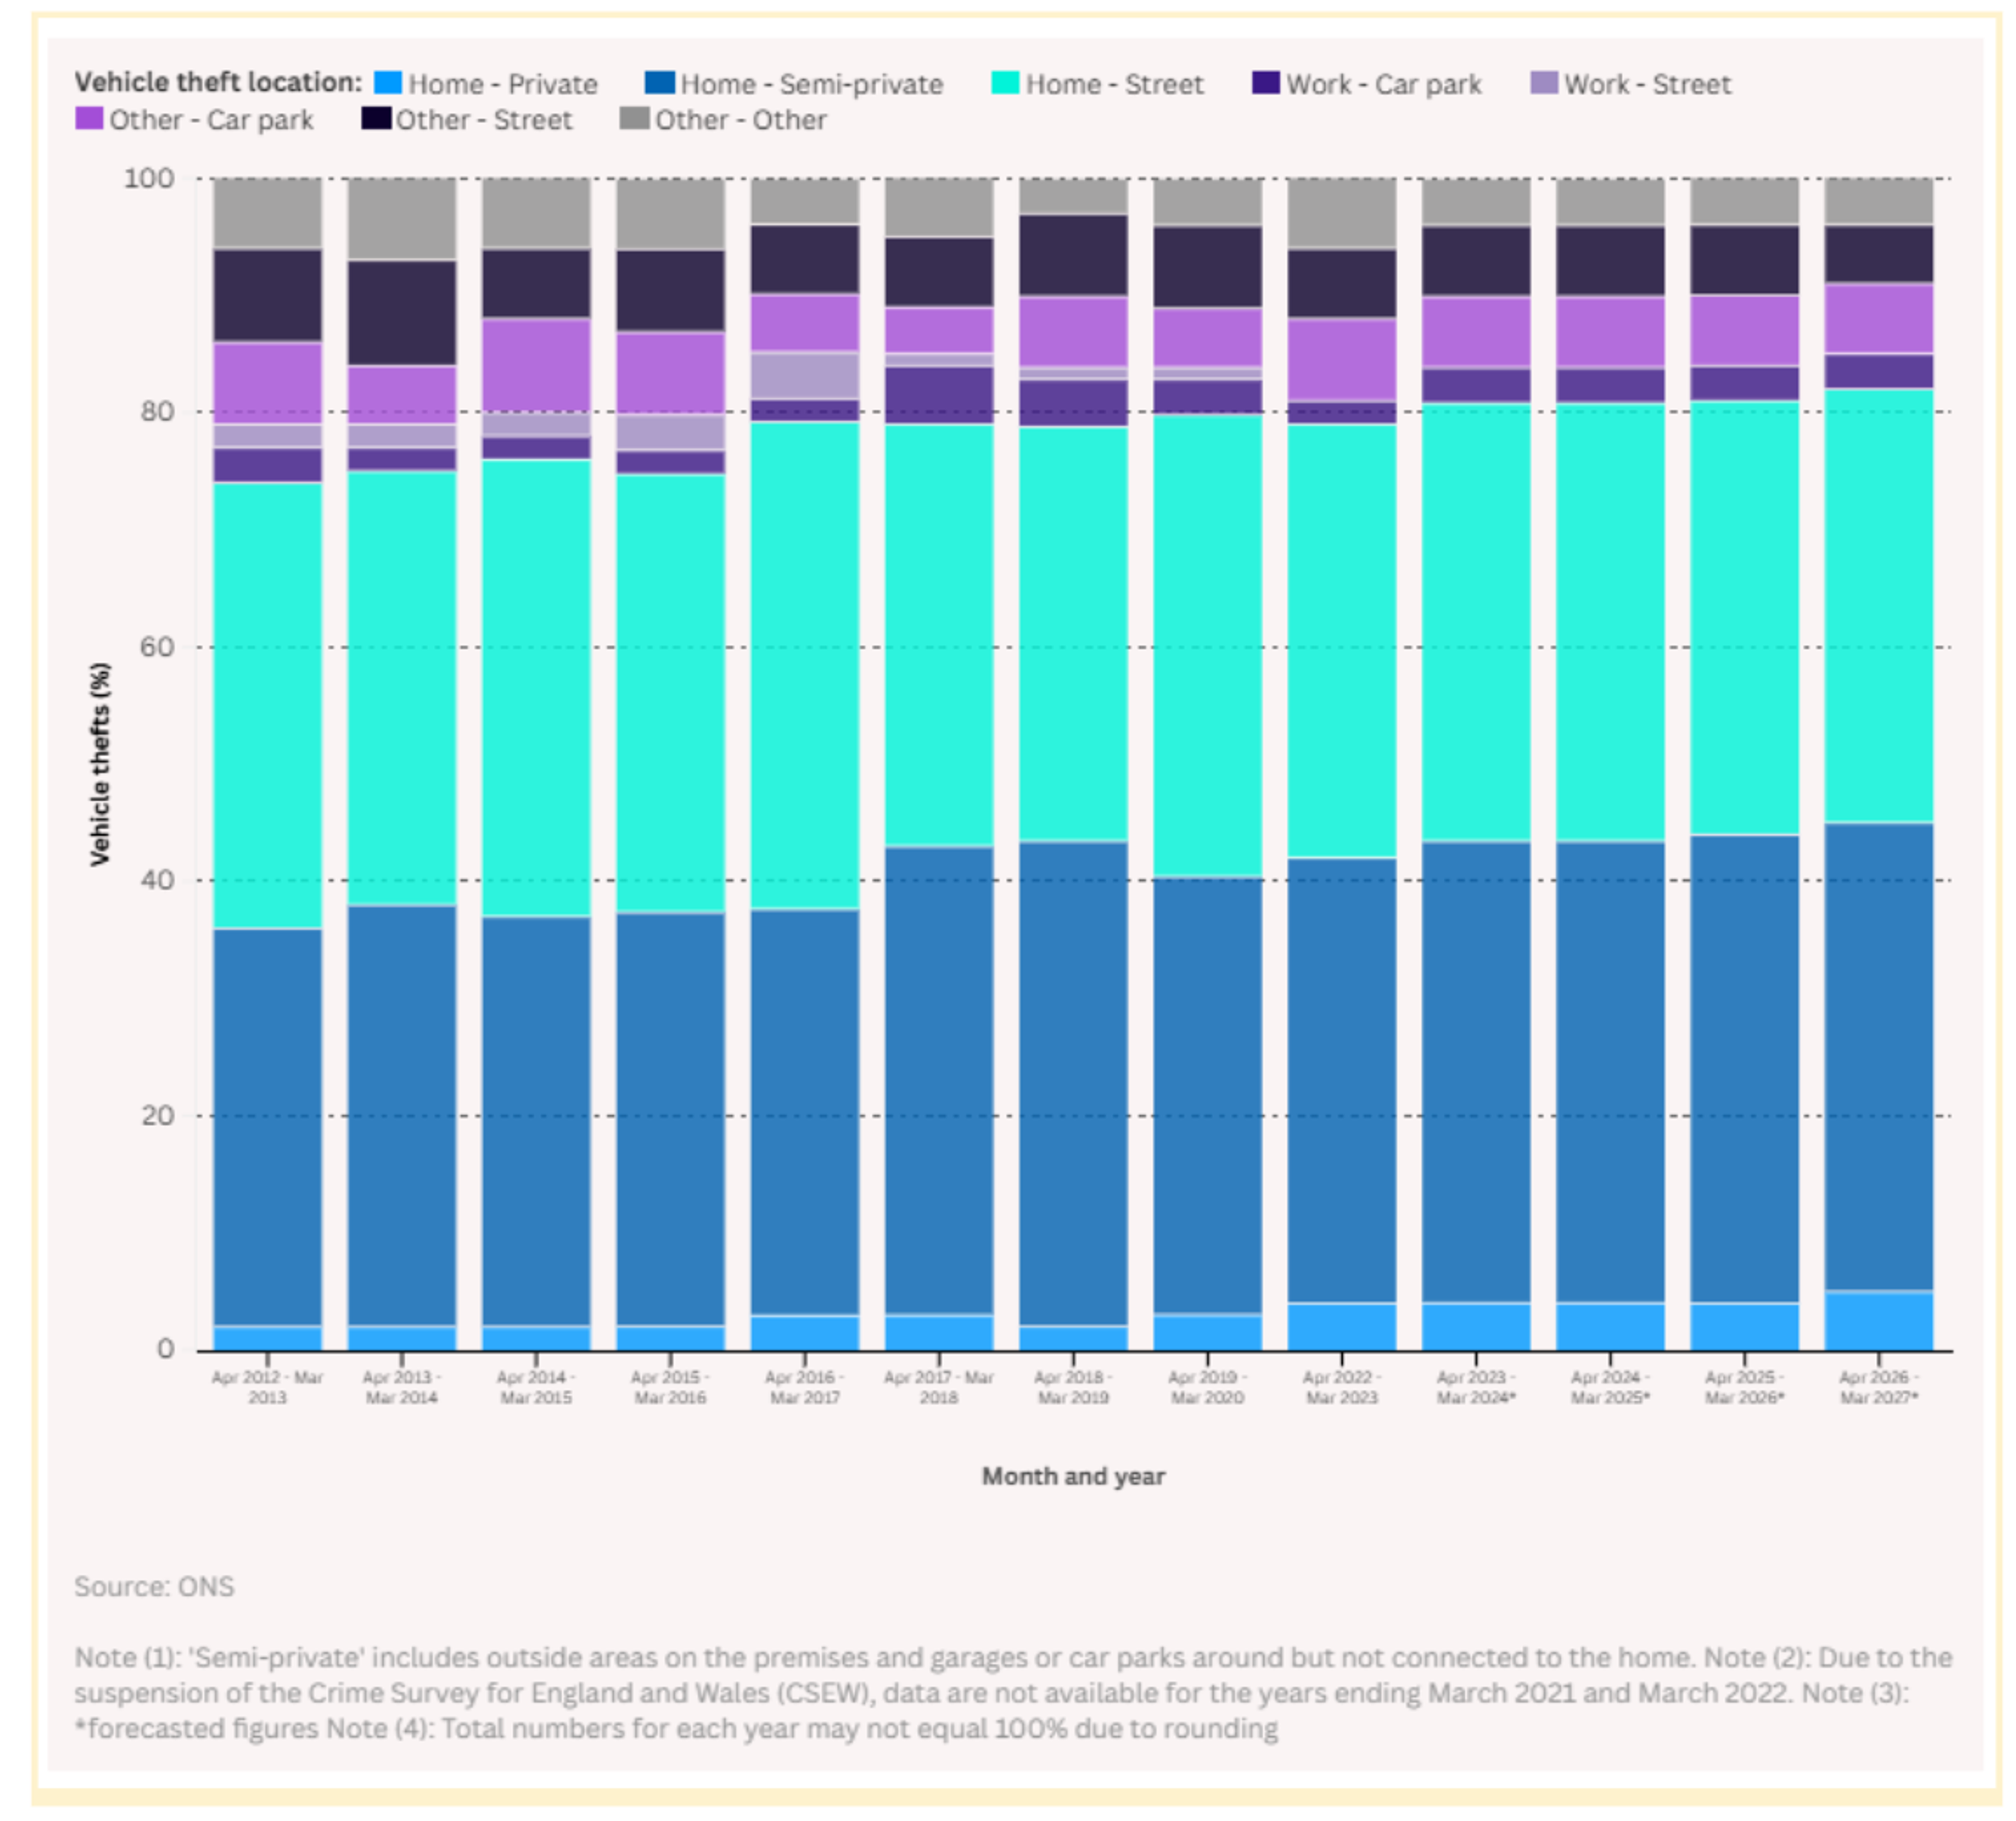
^ Where incidents of vehicle-related theft mainly occur
In all, almost four in five (79%) vehicles reported stolen in 2022-23 were from home, with just under one in 10 (9%) taken from a place of work. The latter represents a drop of three percentage points from 2015-16, when closer to 12% of registered vehicle thefts were from work-based locations.
Based on this historical data, these trends are predicted to continue throughout 2025-27, with semi-private home locations remaining the most common place to have a vehicle stolen, at around two in five (40%) reported cases by March 2027.
European vehicle theft statistics
According to recent car theft statistics, France has the highest rate of vehicles reported stolen, with 248 per 100,000 people. This is around 8.4% greater than Greece in second place, despite having a population around six times bigger.
In France, this translates to around 451 reported vehicle thefts a day (or typically 19 per hour). This is followed by Italy with 369 vehicles a day recorded stolen, the equivalent of 15 per hour.
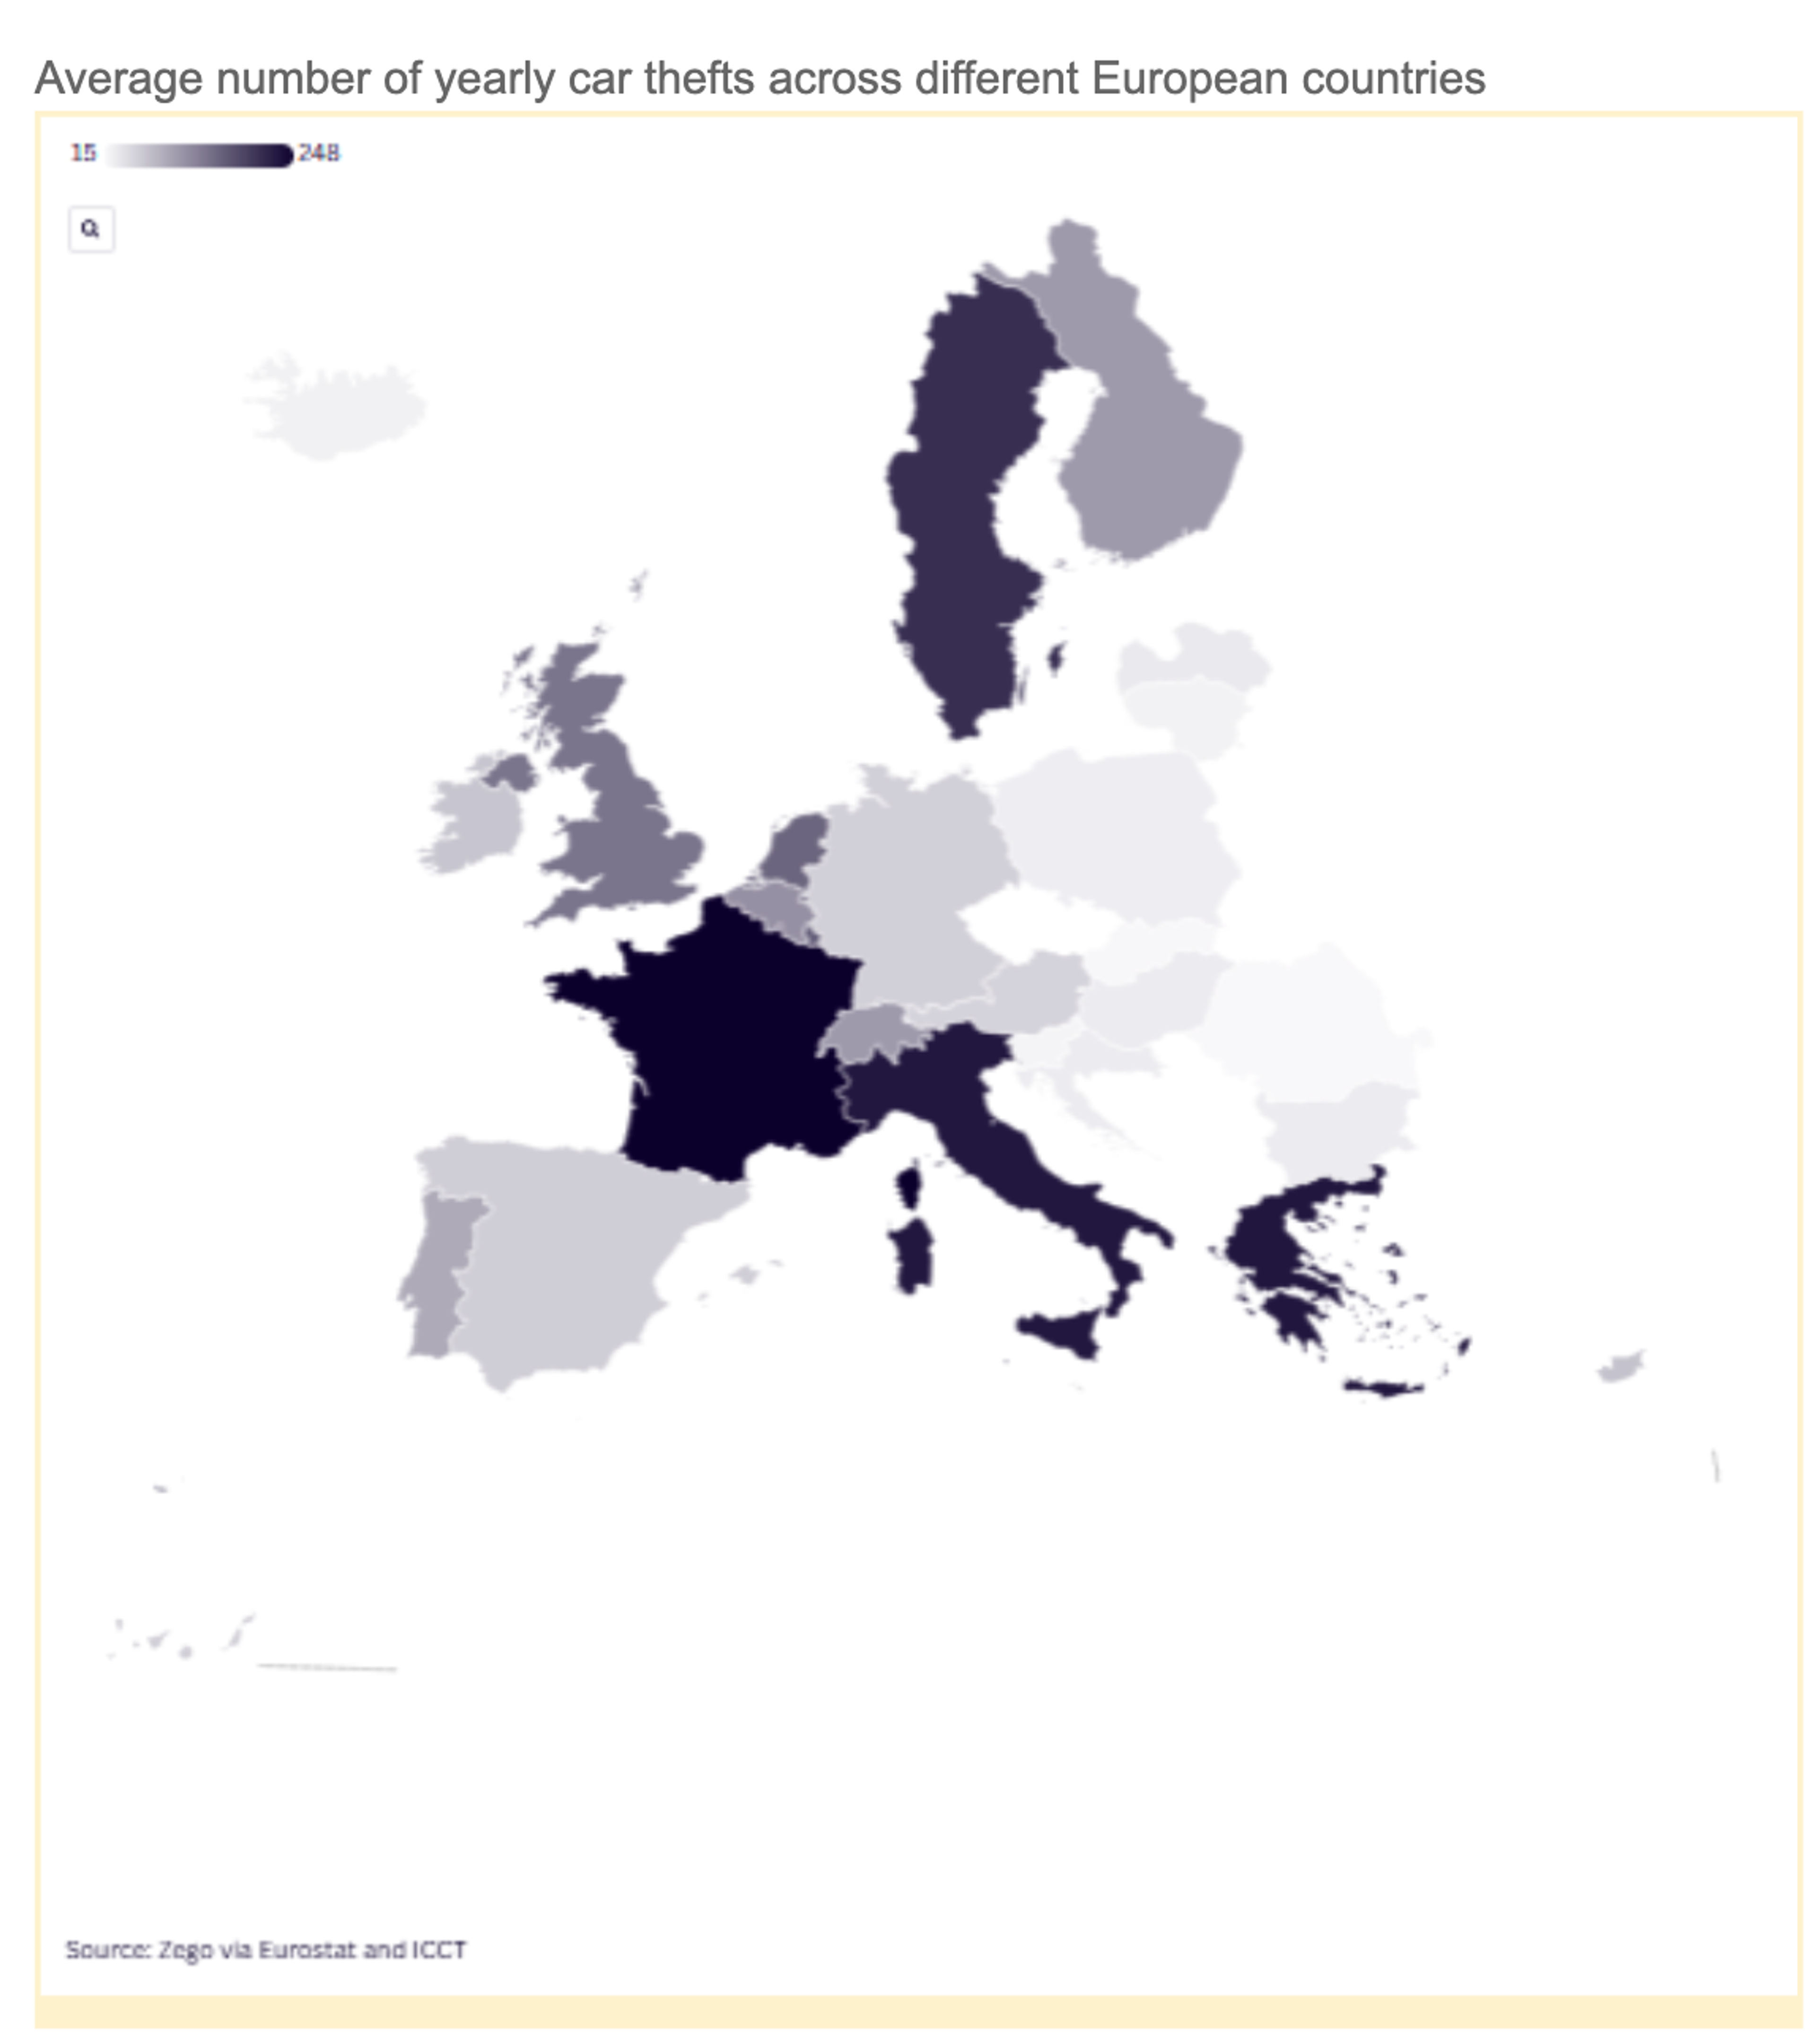
^ Average number of yearly car thefts across different European countries
Incidentally, the United Kingdom places seventh with a vehicle theft response rate of 142 per 100,000 residents. Despite this, this equates to an average of 268 vehicles stolen each day, or around 11 per hour, making it the third most prevalent country in Europe for reported car theft statistics.
Average cost of vehicle theft
Average cost of damage from vehicle theft
As of April 2022 - March 2023, the mean average cost of damage caused by vehicle theft was £1,082, a rise of more than 200% from 2019-20. In other words, the typical cost of damage from vehicle theft tripled in the space of three years.
Between 2012-2020, this value fluctuated year-on-year from a peak of £433 in 2012-13 to a low of £301 the following year.
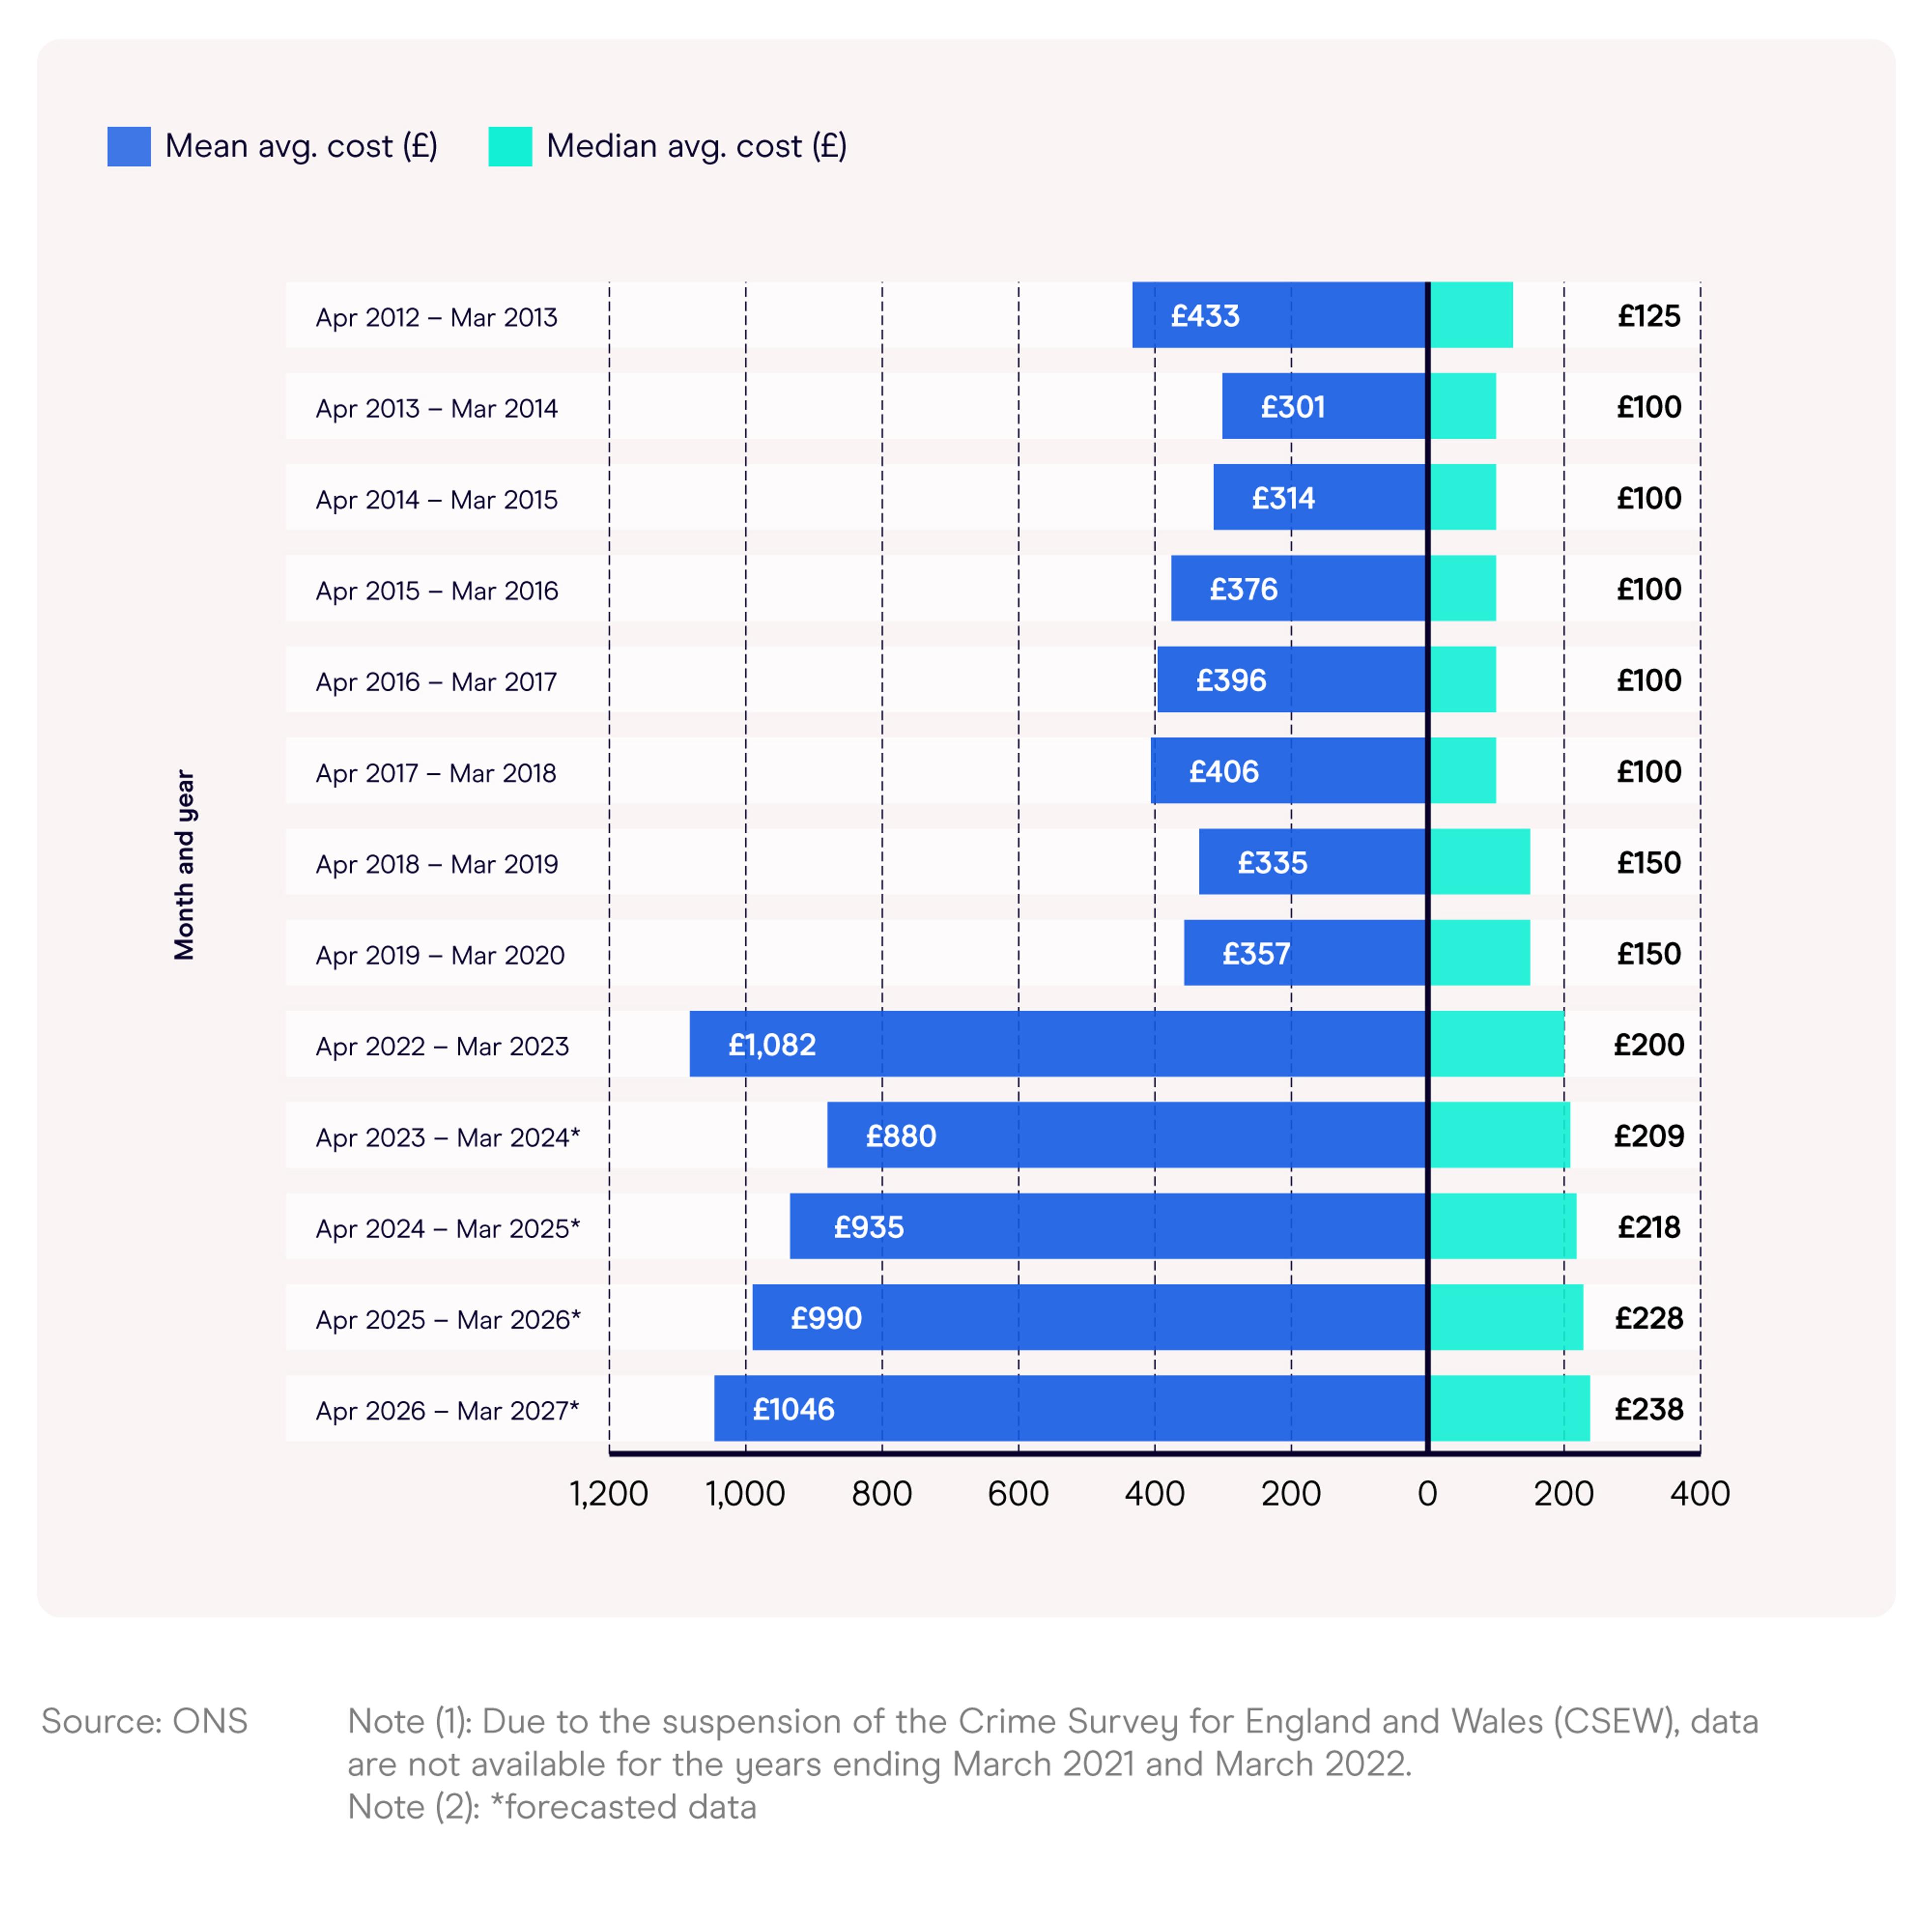
^ Mean and median average cost of damage from vehicle theft over time
The median average cost of damage from vehicle theft in England and Wales has gradually risen over time, from around £100 every year between 2013-2018, up to £200 between April 2022 and March 2023.
The rise in median average cost statistics is predicted to continue between 2024-27, rising year-on-year to £238 by 2027 (an increase of 13.9% in the space of four years).
This follows a similar pattern to the forecasted mean average cost of damage from vehicle theft during this period, from £880 in 2023-24 up to £1,046 by 2026-27 – a climb of almost a fifth (18.9%).
Did you know?
^ Most common average cost of damage from vehicle theft over time
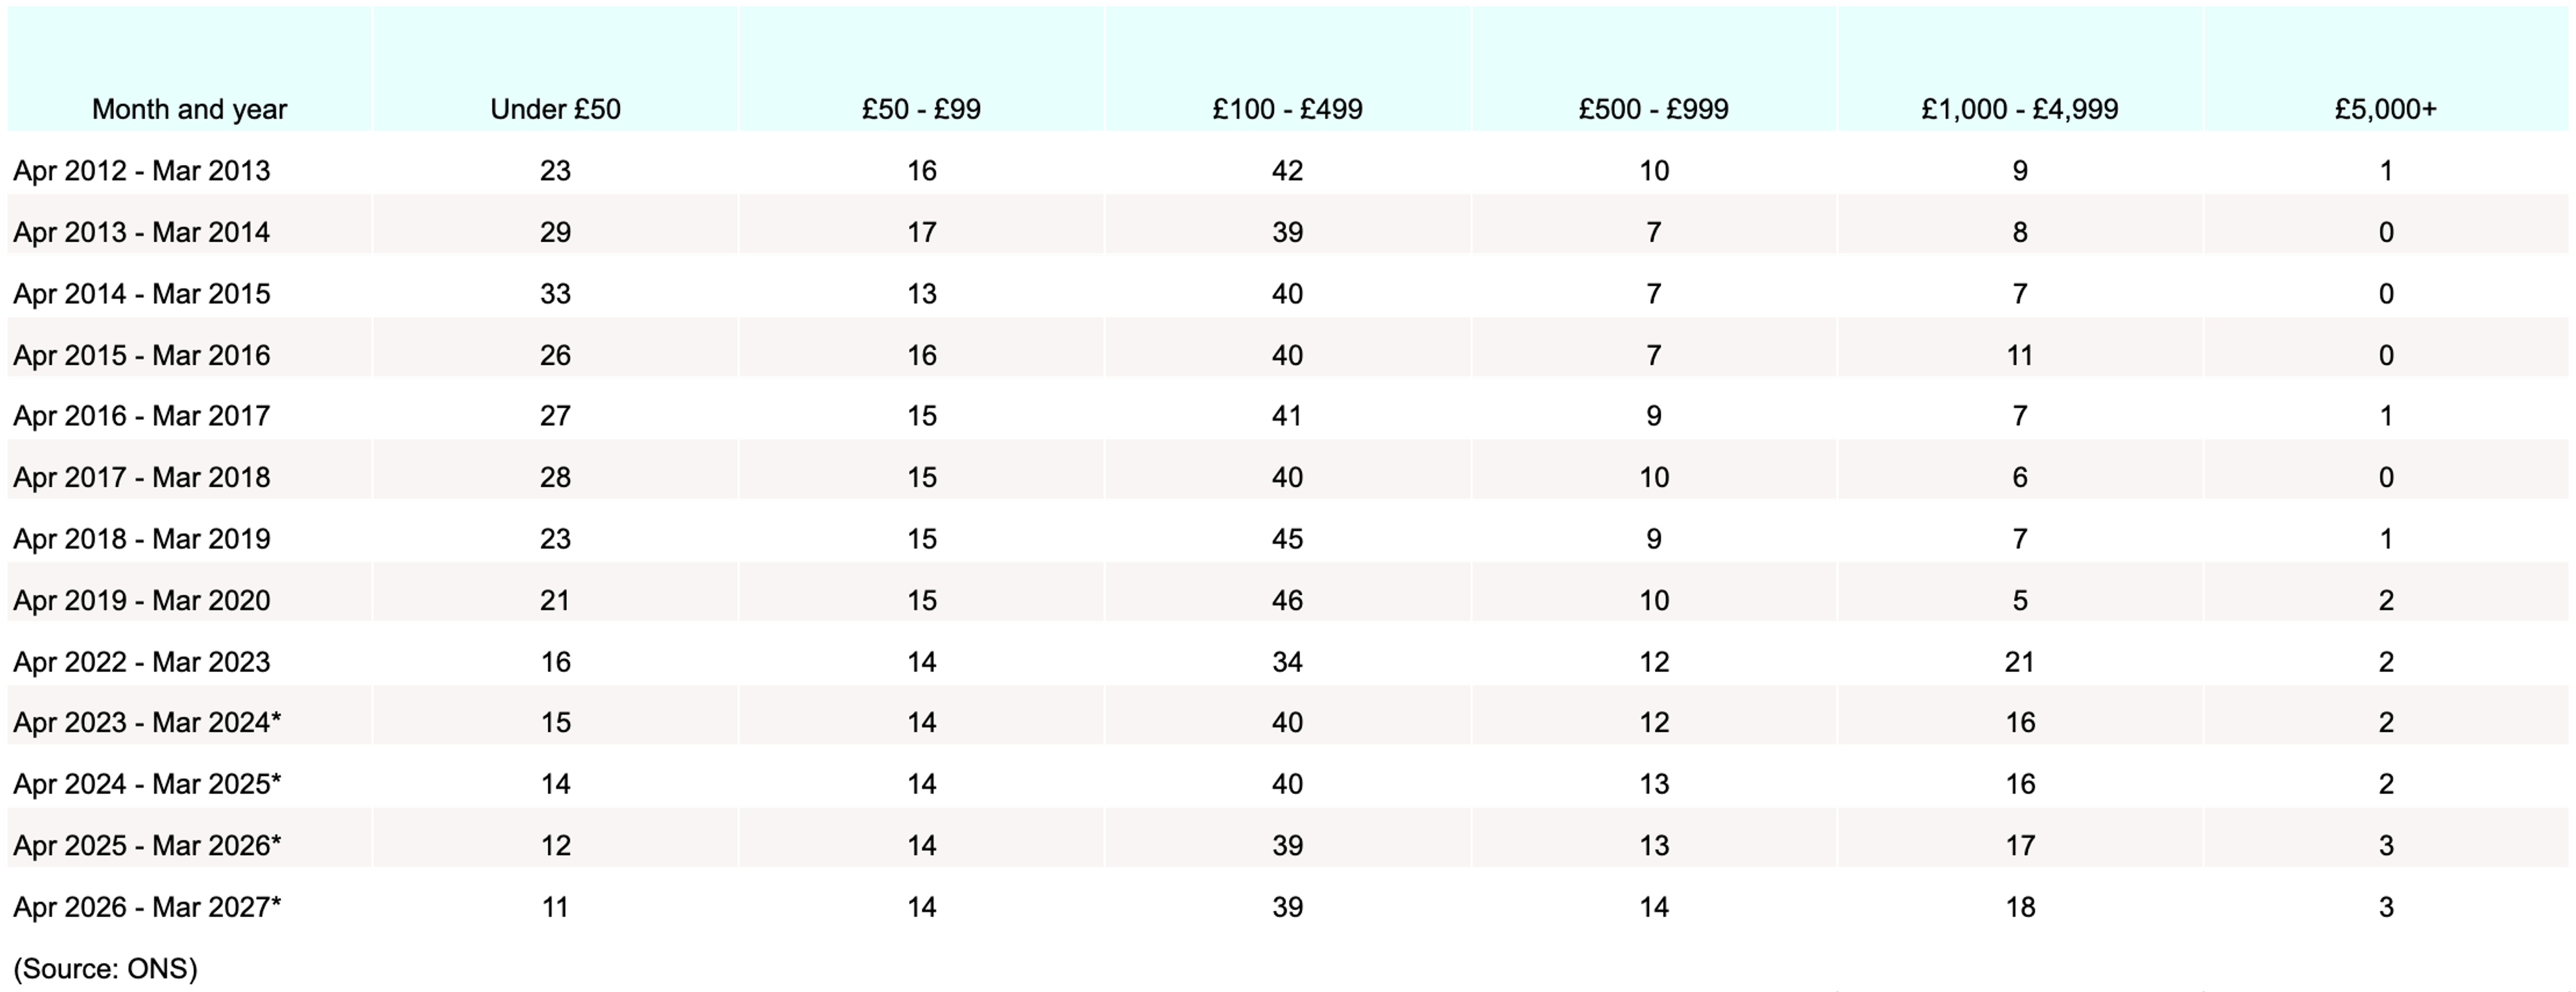
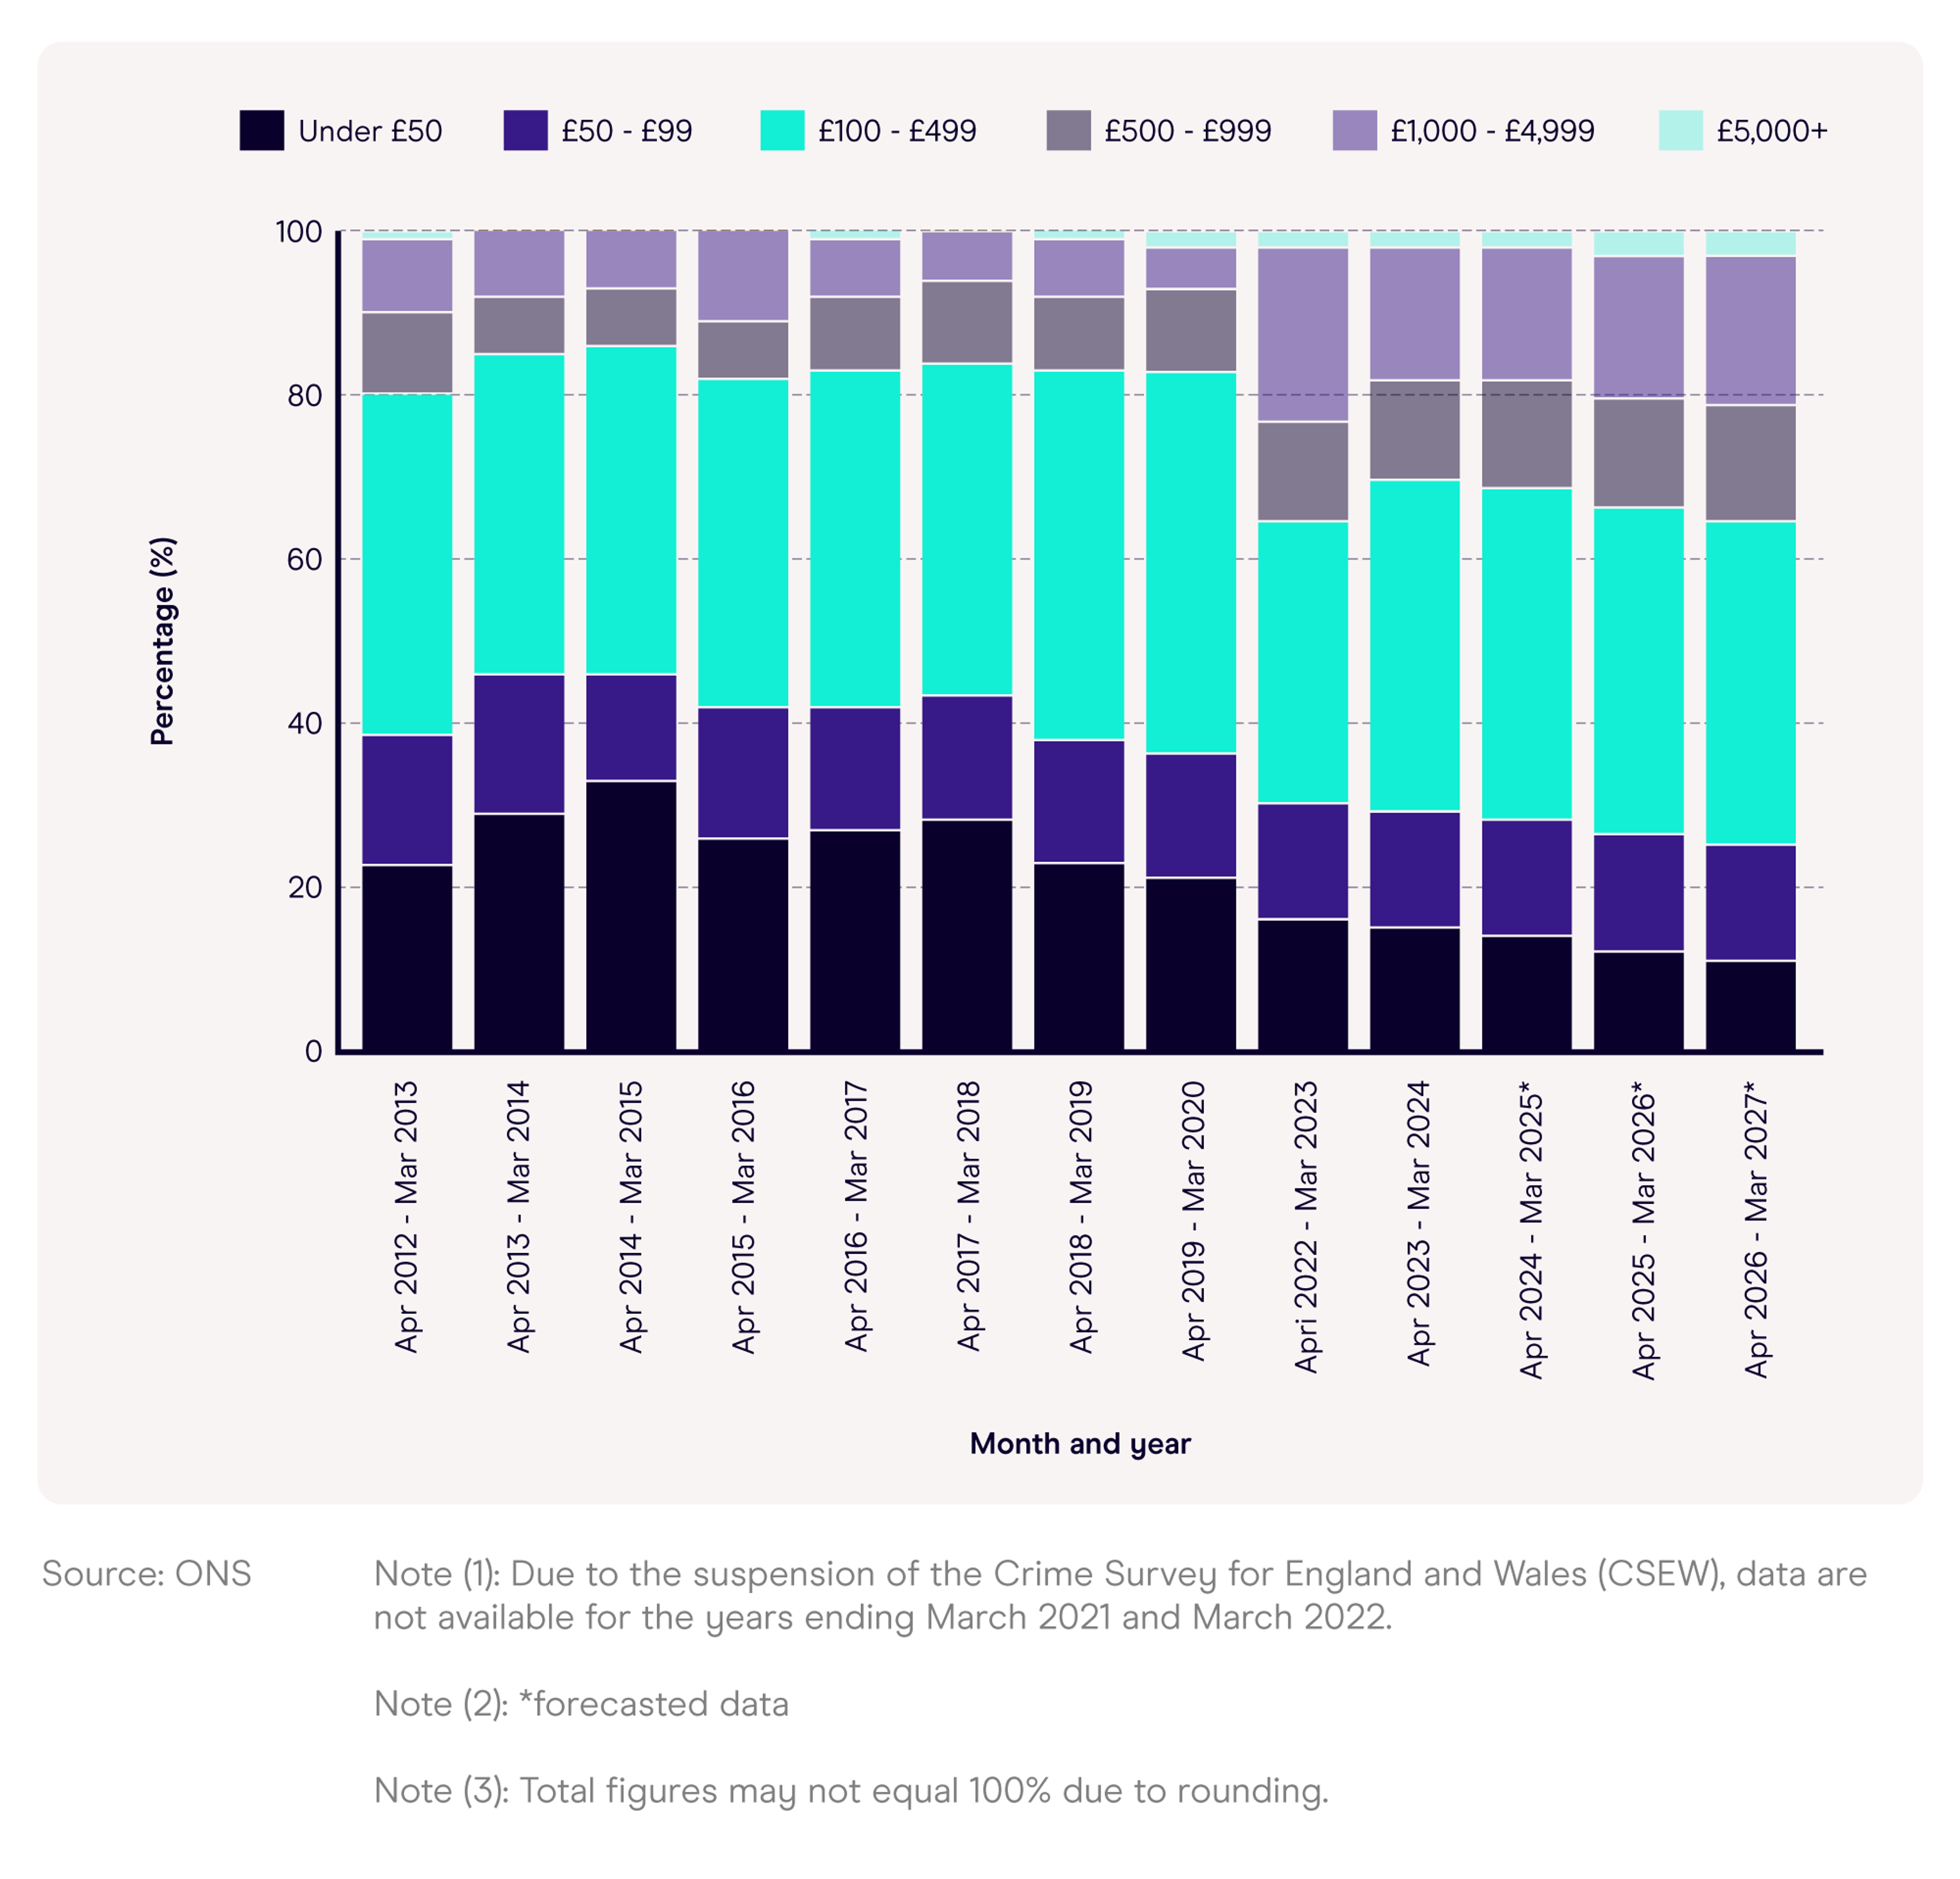
Note (1): Due to the suspension of the Crime Survey for England and Wales (CSEW), data are not available for the years ending March 2021 and March 2022.
Note (2): *forecasted data
Note (3): Total figures may not equal 100% due to rounding.
Typically, the most common average cost of damage from reported vehicle theft in England and Wales falls between £100 and £499. As of April 2022 and March 2023, this accounted for just over a third (34%) of all recorded vehicle thefts for the year.
In the same period, just over a fifth (21%) of vehicle thefts reported costs between £1,000 and £4,999 – a 16-percentage-point increase from 2019-20 and the highest recorded figure in the last 10 years
Generally speaking, damage caused by vehicle theft has typically fallen between £100 and £499 since 2012. However, the 2022-23 reported figure of 34% from this category is 12 percentage points lower than the peak of just under half (46%) in 2019-20.
Between 2024-27, the amount of damage caused by vehicle theft is expected to increase for the higher cost brackets. By 2027, almost a fifth (18%) of reported vehicle thefts could cost between £1,000 and £4,999 – a two-percentage-point increase from 2024. Simultaneously, damage costing an average of less than £50 is expected to fall by four-percentage-points, down to just over a tenth (11%) of all reported vehicle theft in 2027.
Most commonly stolen items from vehicles
The most recent ONS vehicle theft statistics indicate that valuables are the most commonly stolen items from vehicles as of 2022-23, accounting for more than a third (35%) of robberies.
This is followed by the removal of exterior fitting (21%) and other vehicle parts (18%).
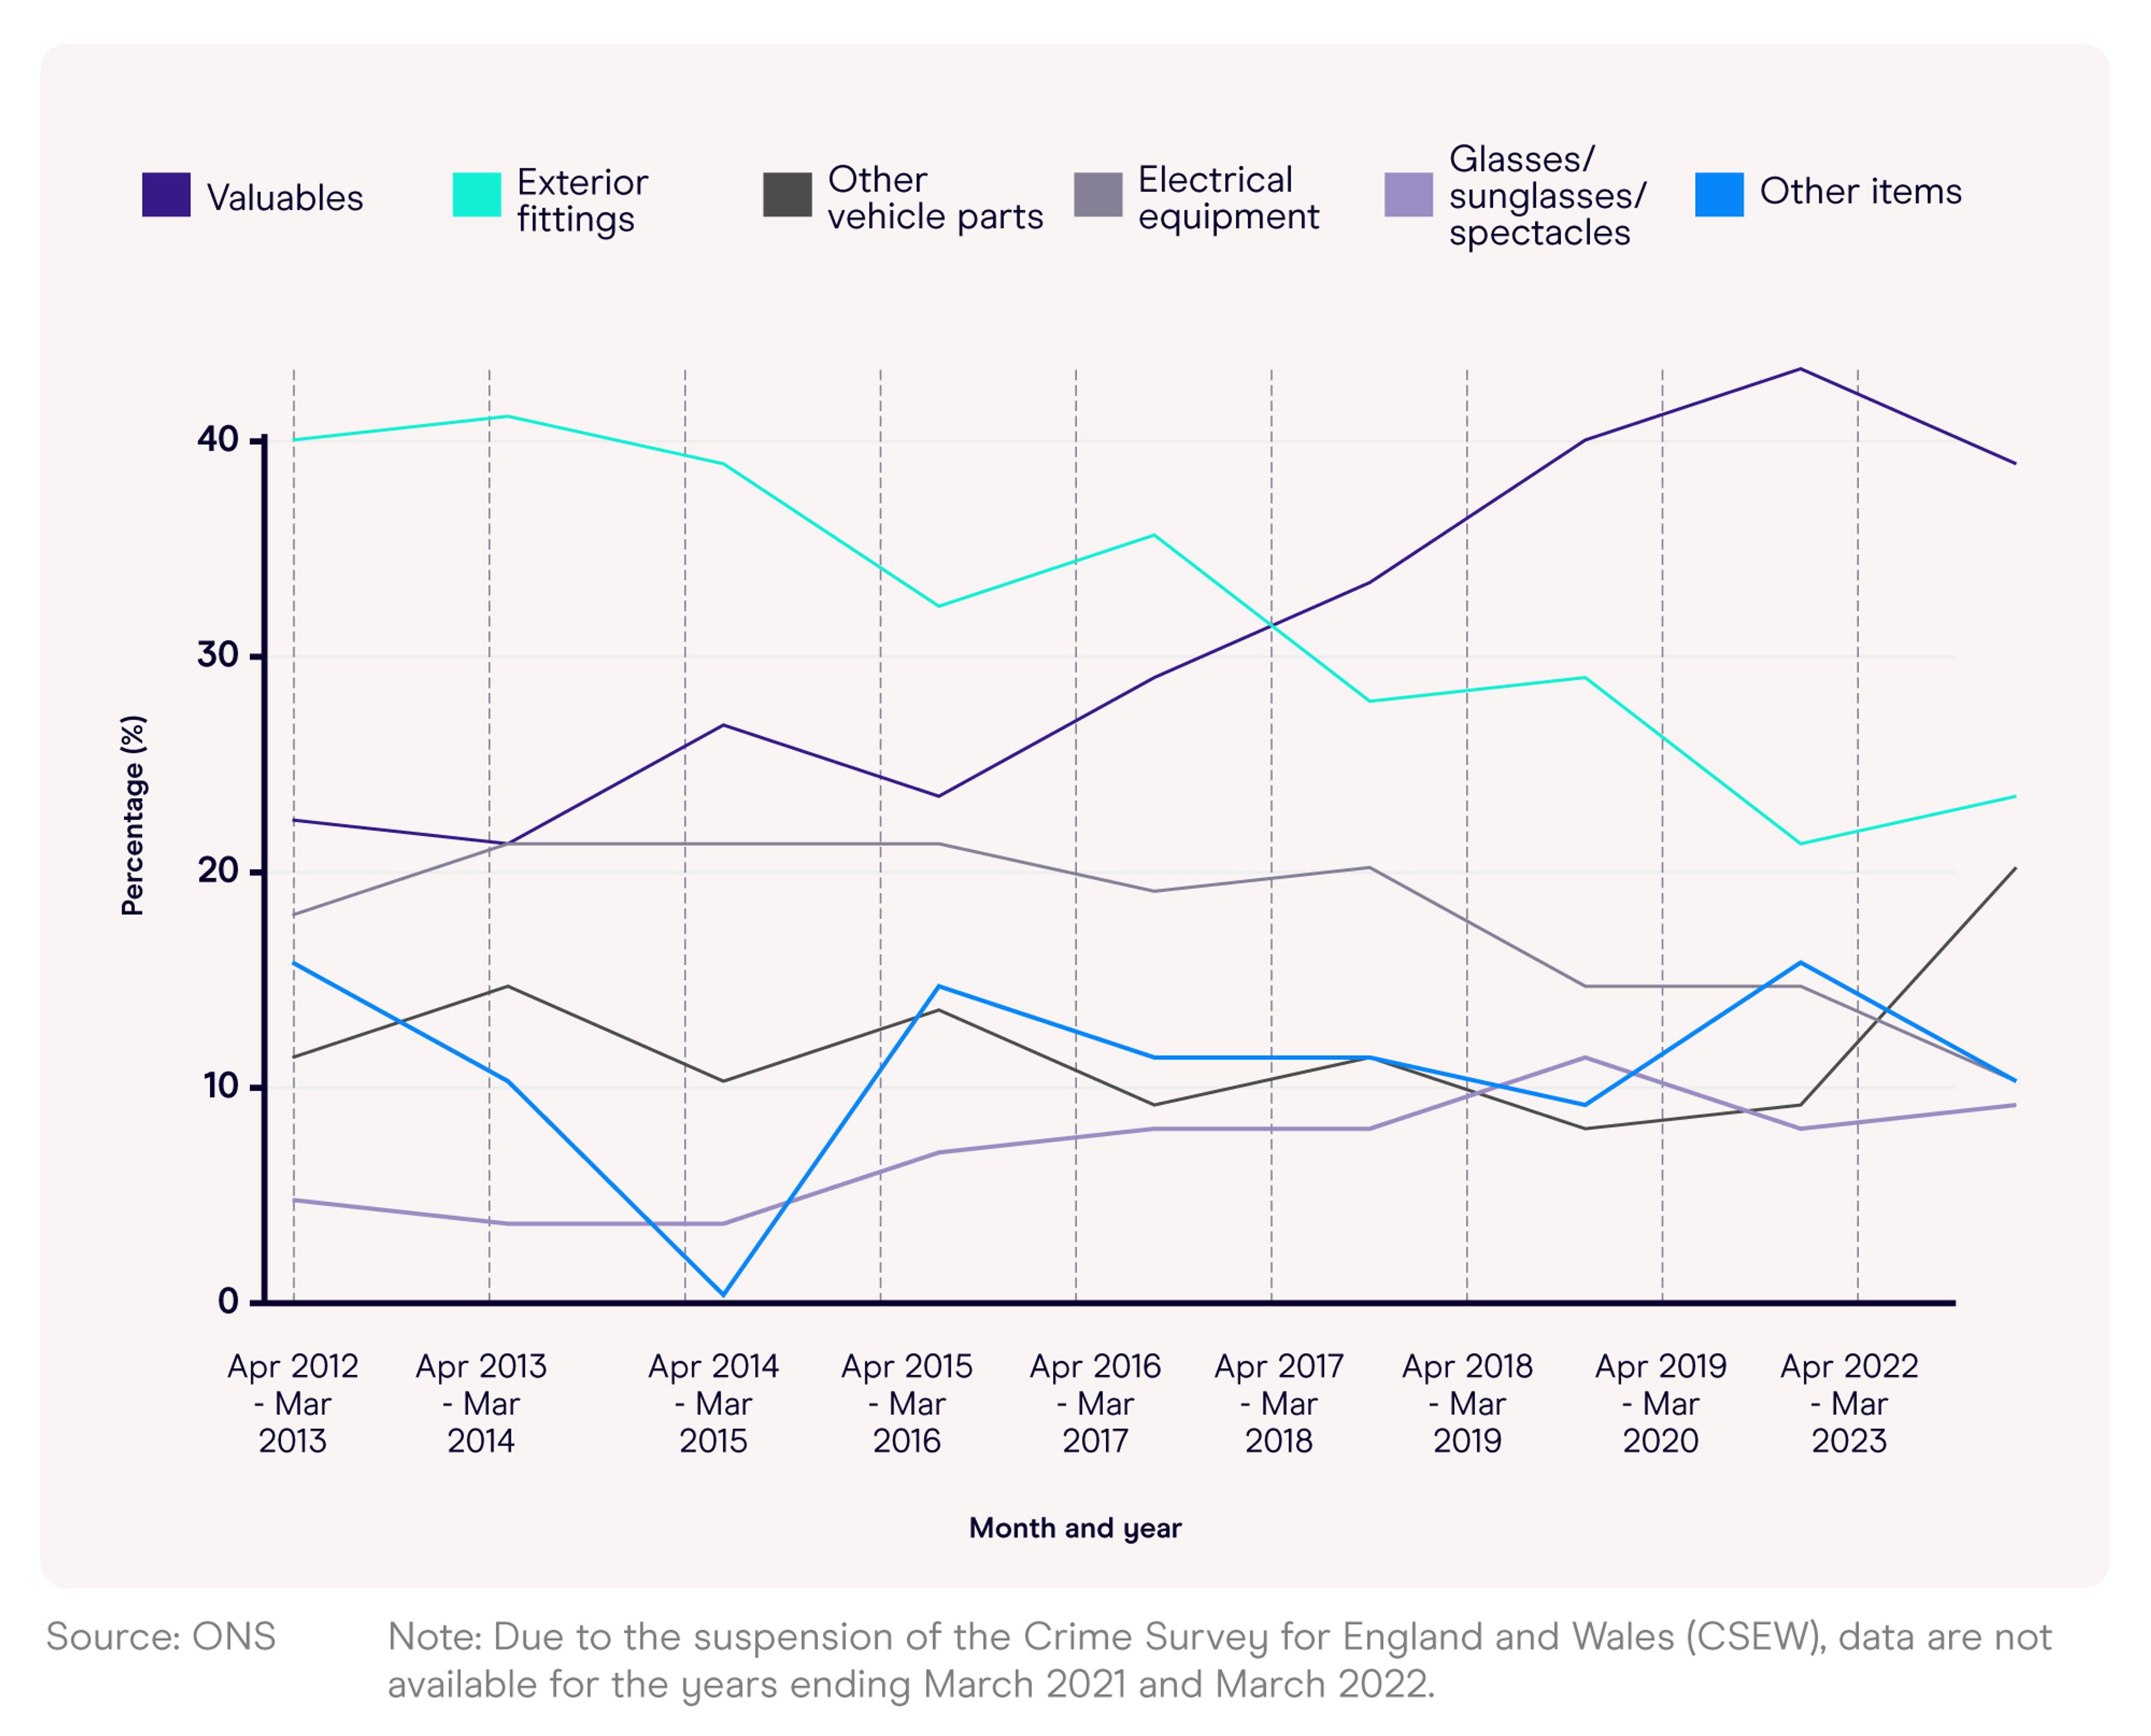
^ Most commonly stolen items in incidents of vehicle theft over time
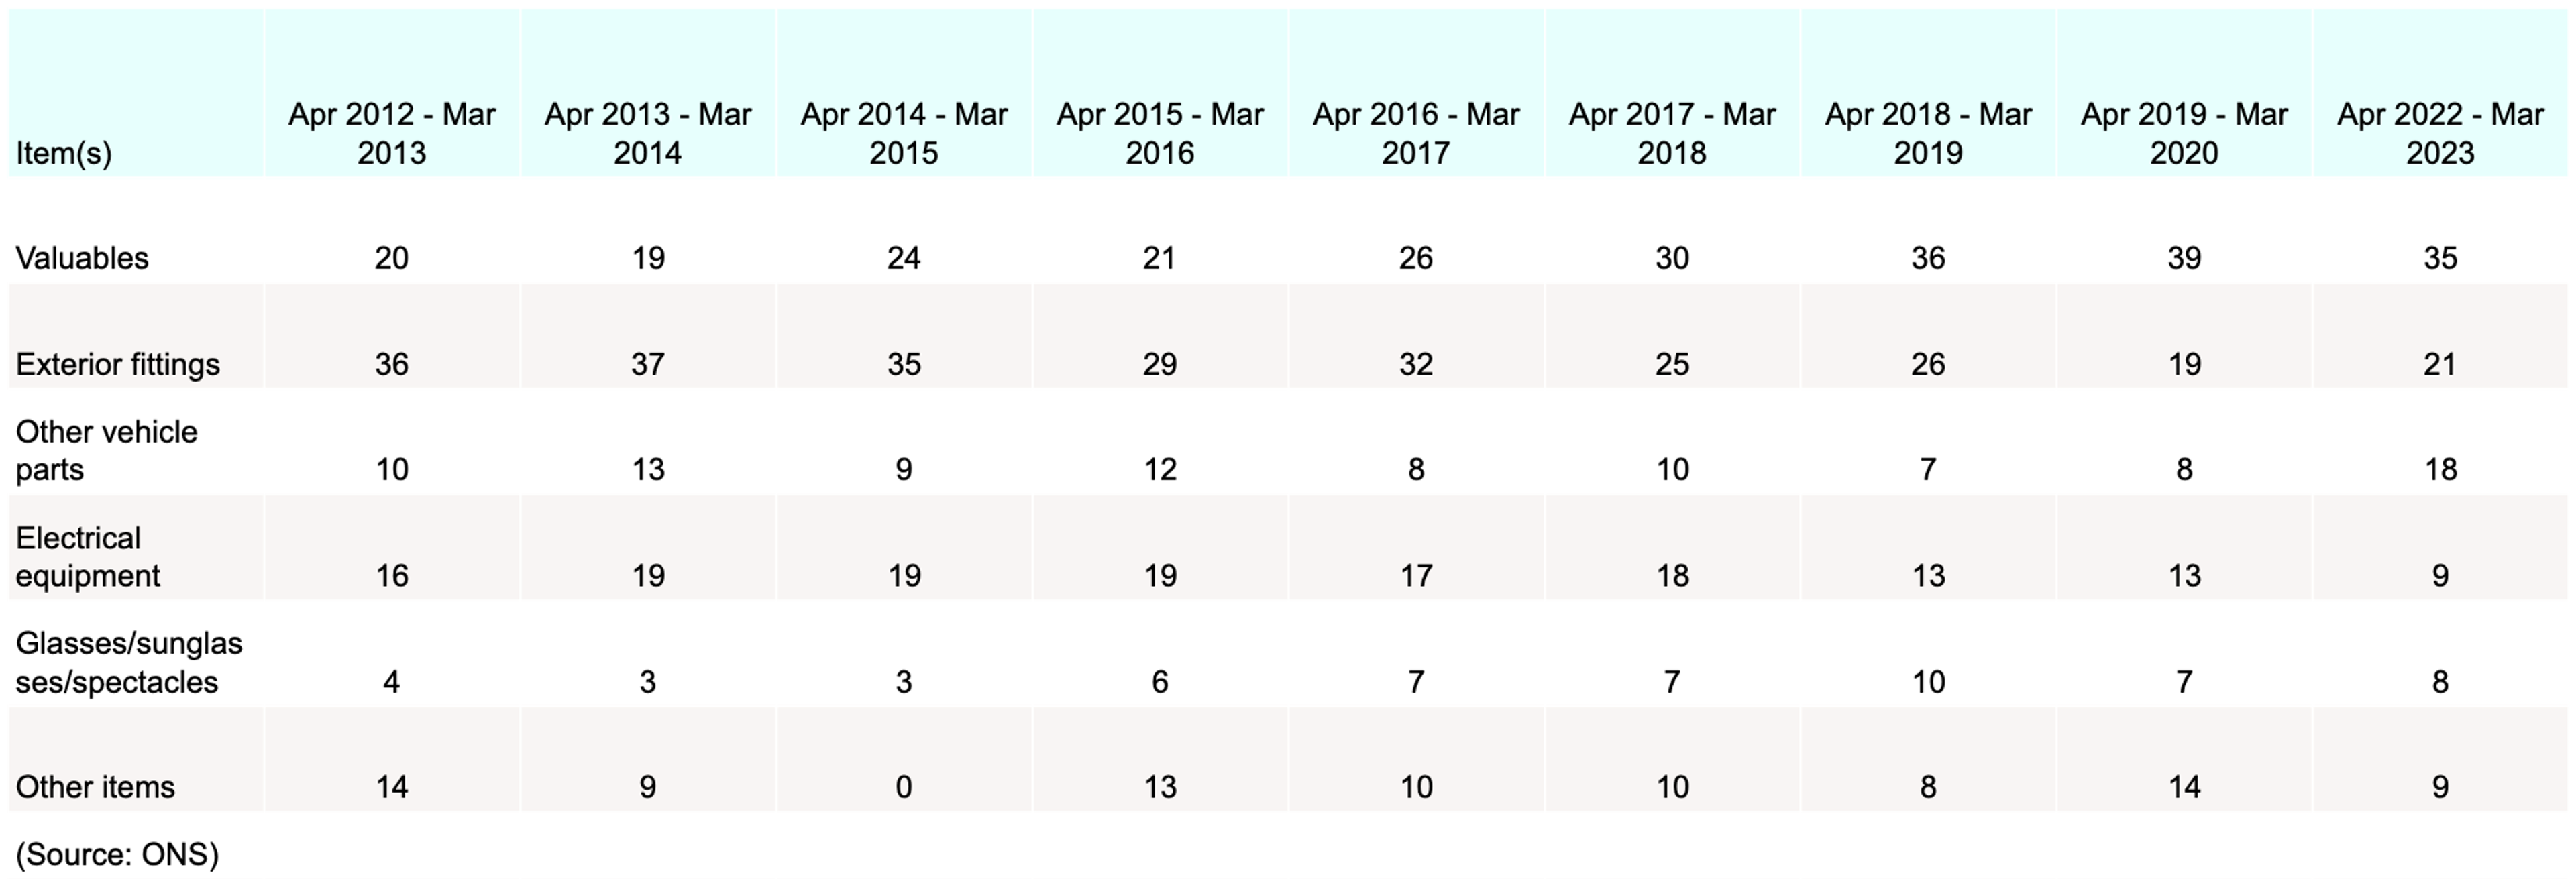
Note: Due to the suspension of the Crime Survey for England and Wales (CSEW), data are not available for the years ending March 2021 and March 2022.
Historically, across England and Wales, exterior fittings were more popular items to steal amongst car thieves, accounting for almost two-fifths (37%) of reported vehicle thefts in 2013-14. However, since 2017-18, valuables have become the most desired stolen items from cars.
Average cost of most commonly stolen items from vehicles
The mean average cost of stolen items from vehicles in England and Wales in 2022-23 was £14,416. This figure has generally risen year-on-year since 2012 (except 2017-18 which saw a slight decrease). Back in 2012-13, stolen items from vehicles averaged £3,991 – around 3.5 times less than the 2022-23 reported figures.
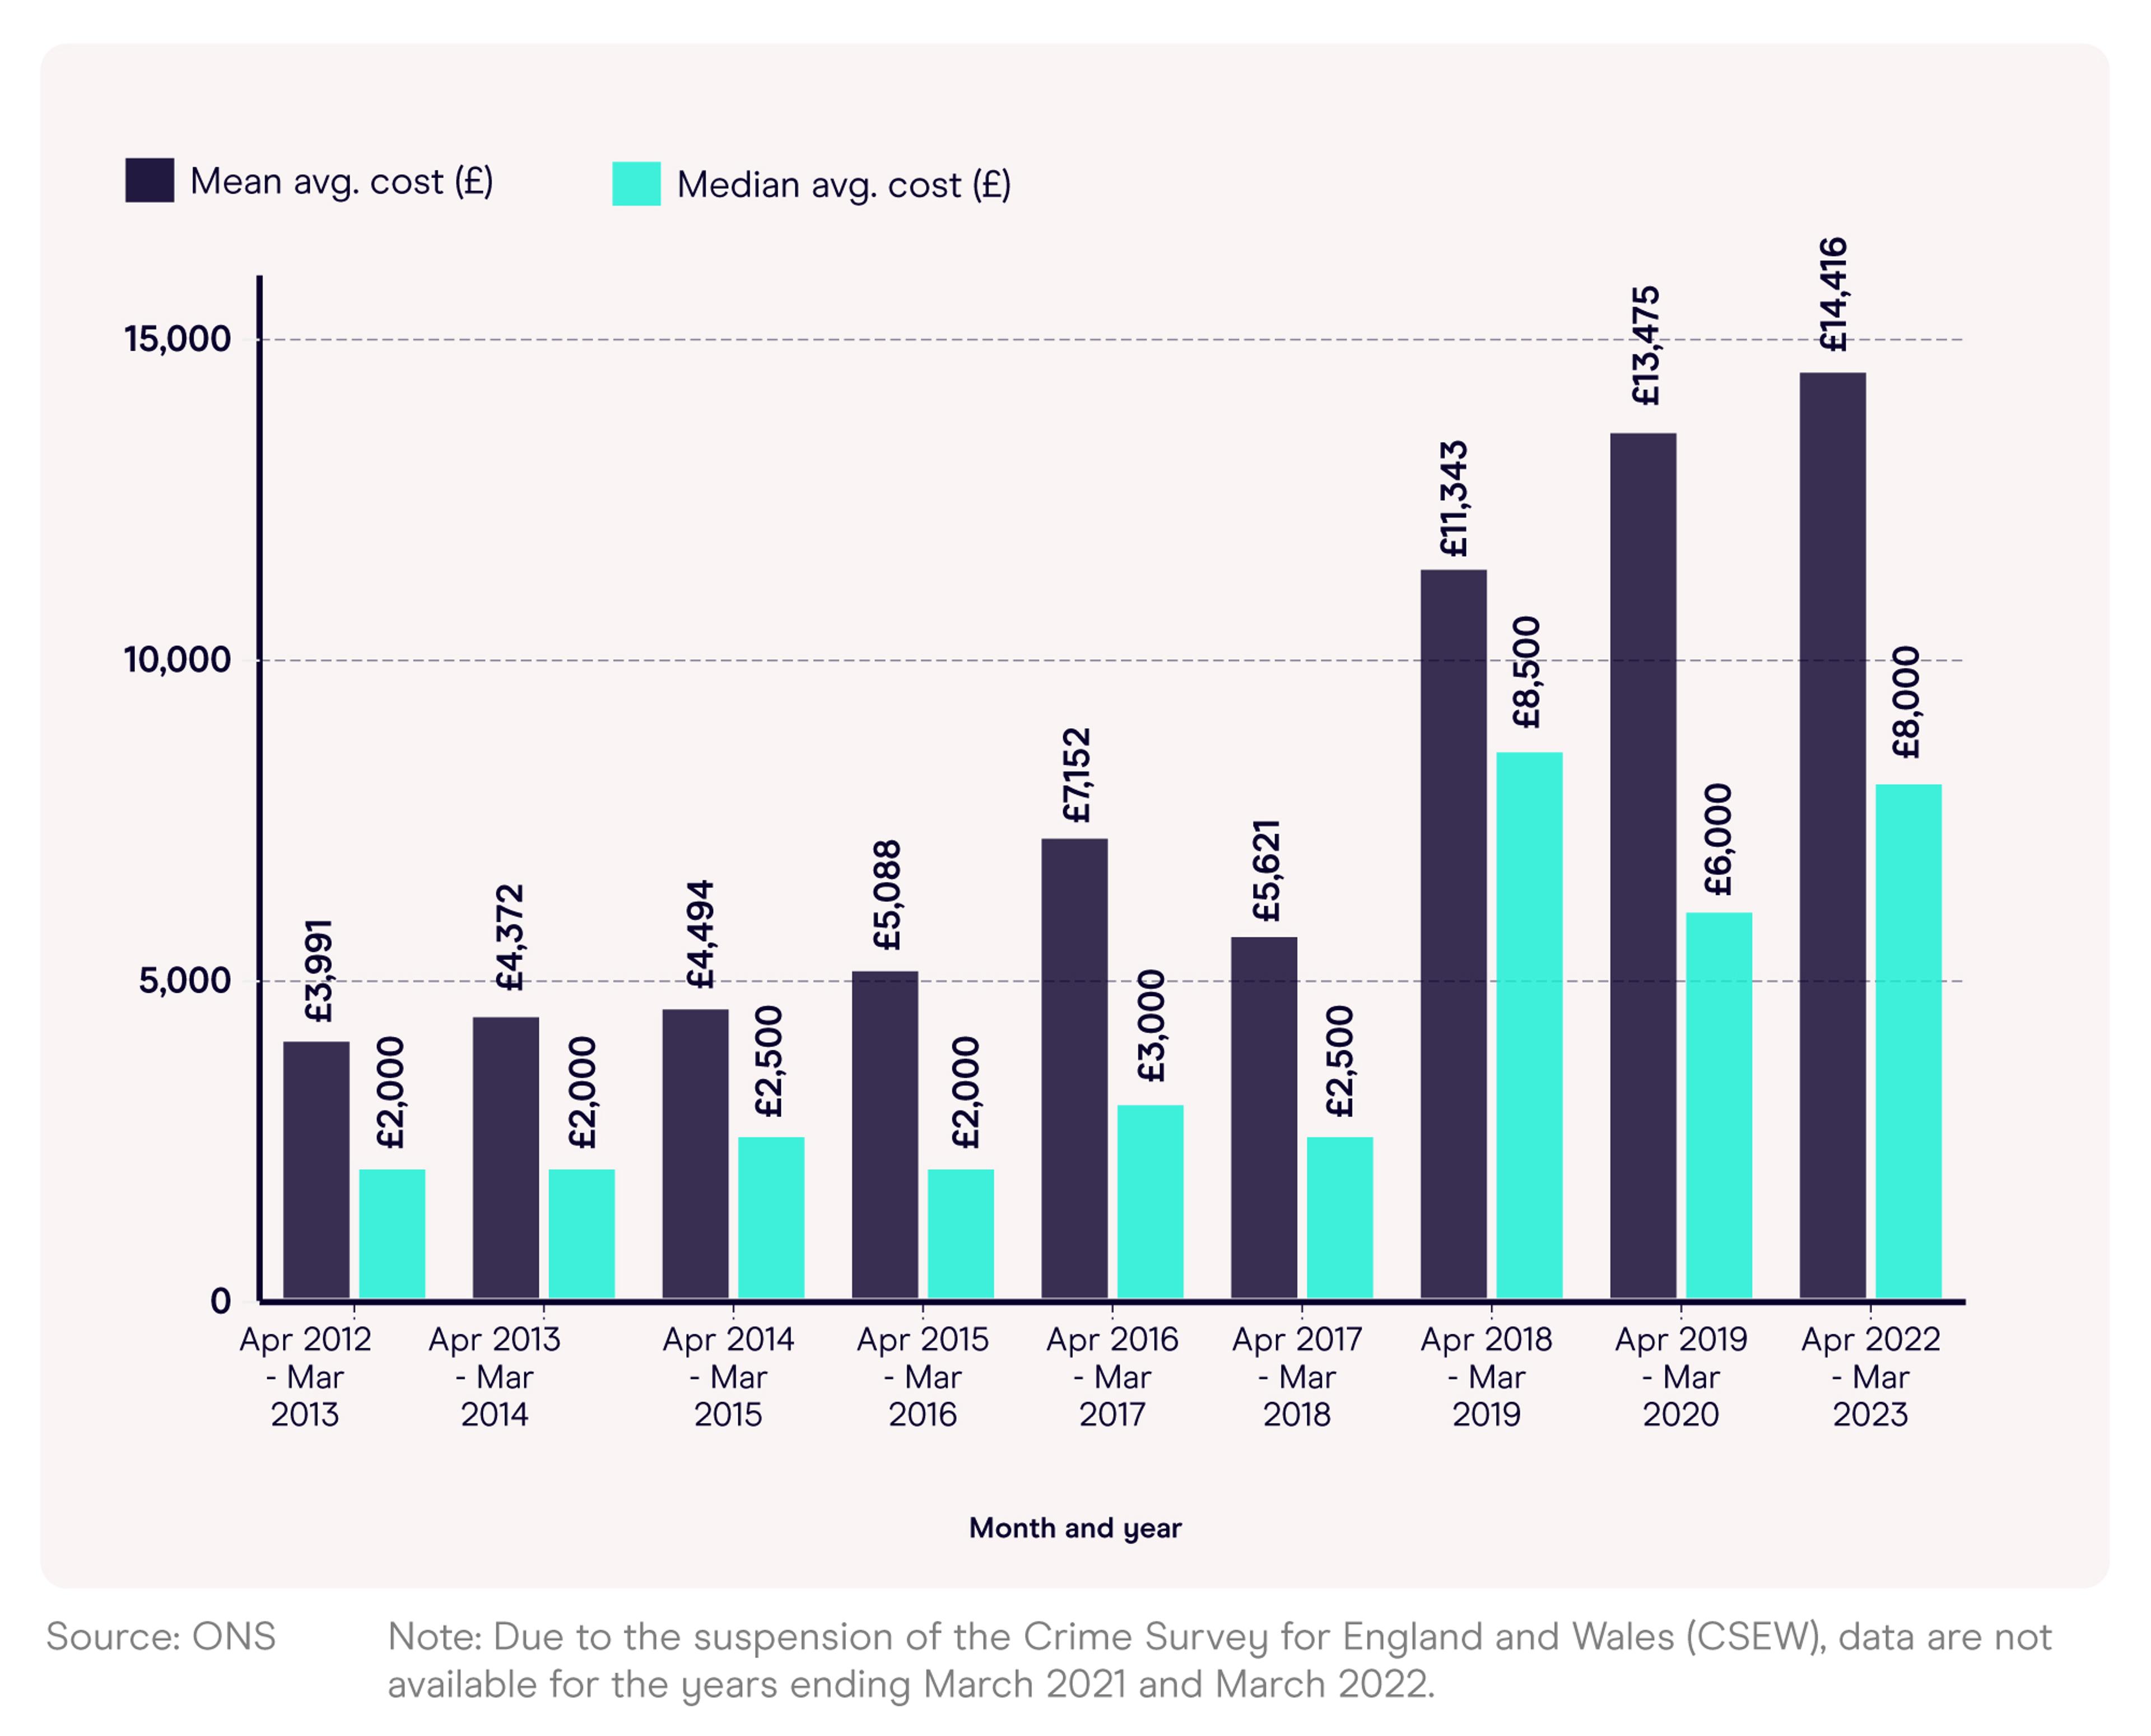
^ Mean and median average cost of items stolen from vehicle theft over time
By contrast, the median average cost of damage from vehicle theft in 2022-23 was reported to be £8,000 – a figure that has quadrupled since 2012-13 – yet it is slightly below the peak of £8,500 in 2018-19.
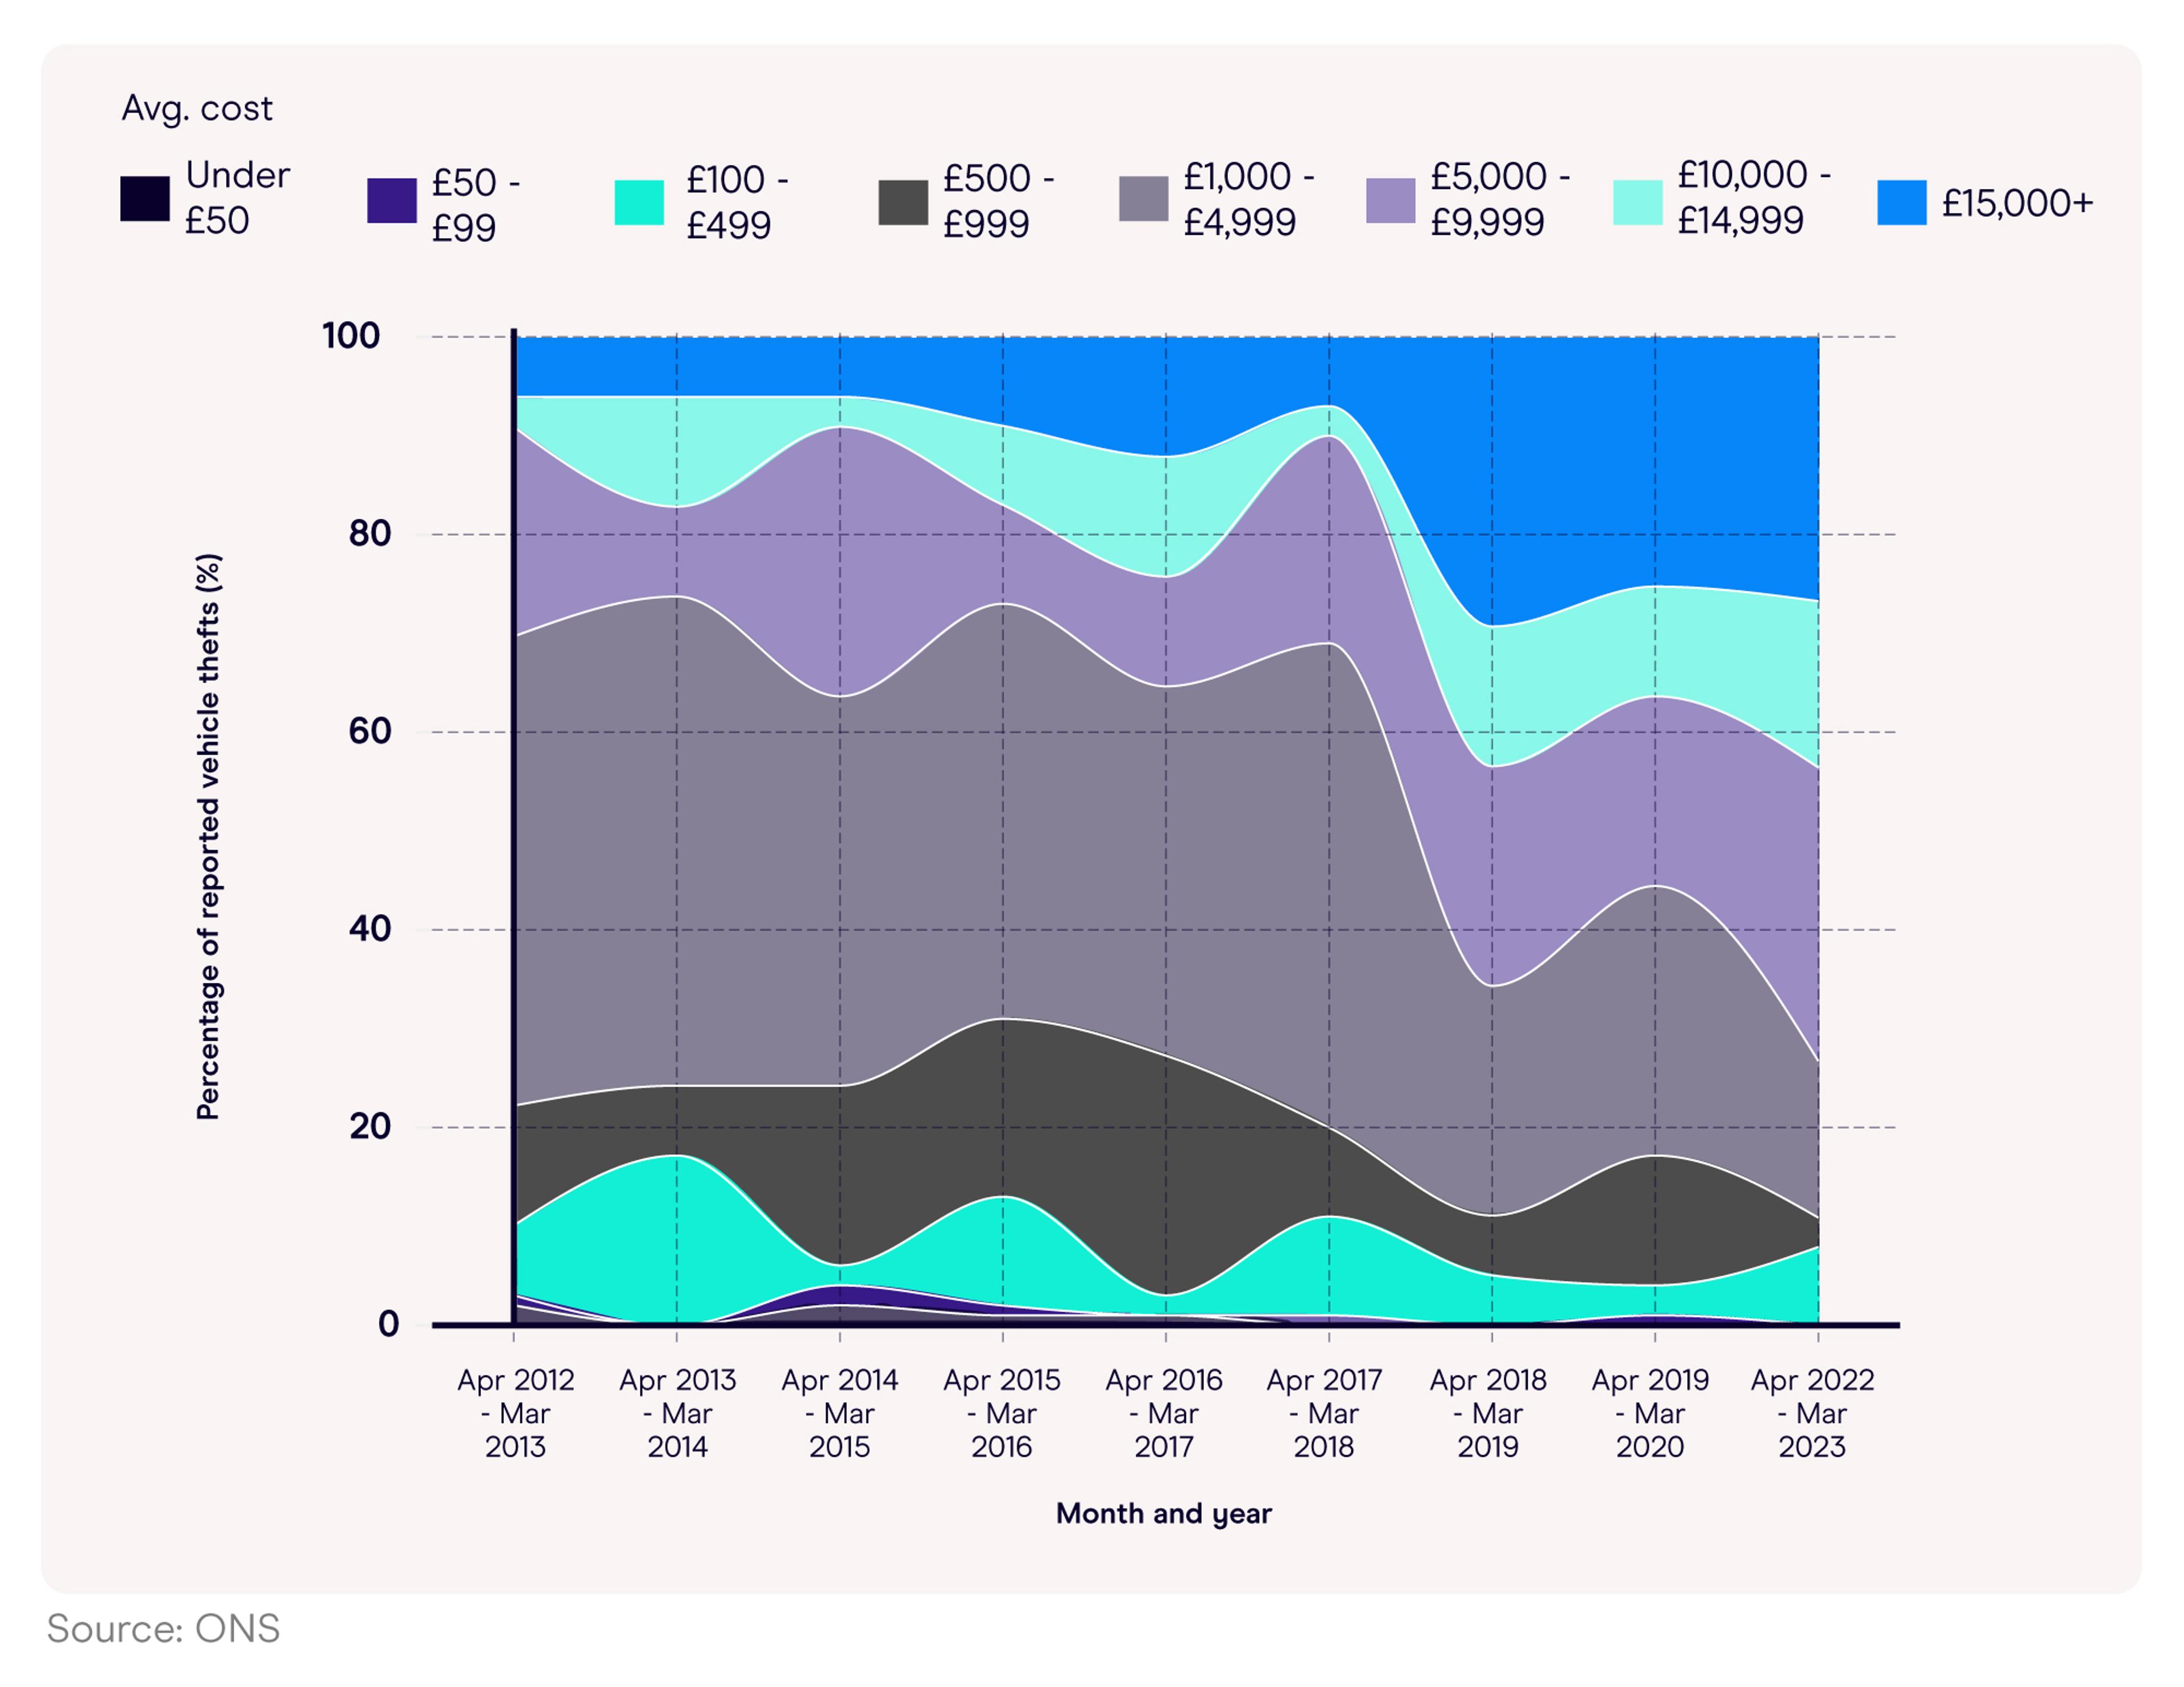
^ Most common average cost of items stolen from vehicles over time
Note (1): Due to the suspension of the Crime Survey for England and Wales (CSEW), data are not available for the years ending March 2021 and March 2022.
Note (2): Total figures for each year may not equal 100% due to rounding.
Vehicle theft statistics from the ONS reveal that, as of 2022-23, the most common average cost of stolen items from vehicles was £5,000 - £9,999, accounting for just under a third (30%) of all reported thefts for the year. In the same year, just over a quarter (27%) of all recorded vehicle thefts had items stolen worth more than £15,000 – a figure that remained above 25% between 2018-23.
Over time, there has been a gradual rise in the most common average cost of stolen items from vehicles in England and Wales.
Back in 2013-14,:
- Just under half (49%) of items stolen were valued at £1,000 - £4,999.
- Less than one in 10 (9%) of car thefts had items taken worth between £5,000 and £9,999.
- Even fewer vehicle thefts (just 6%) reported the loss of items typically worth more than £15,000.
Catalytic converter theft statistics
According to car theft stats from the DVLA, there were 19,466 reported thefts of catalytic converters in London between 2021-23 – the most of any area in the country. More than half (54%) of these were reported stolen in 2021, with the numbers dropping year-on-year like many other parts of the UK.
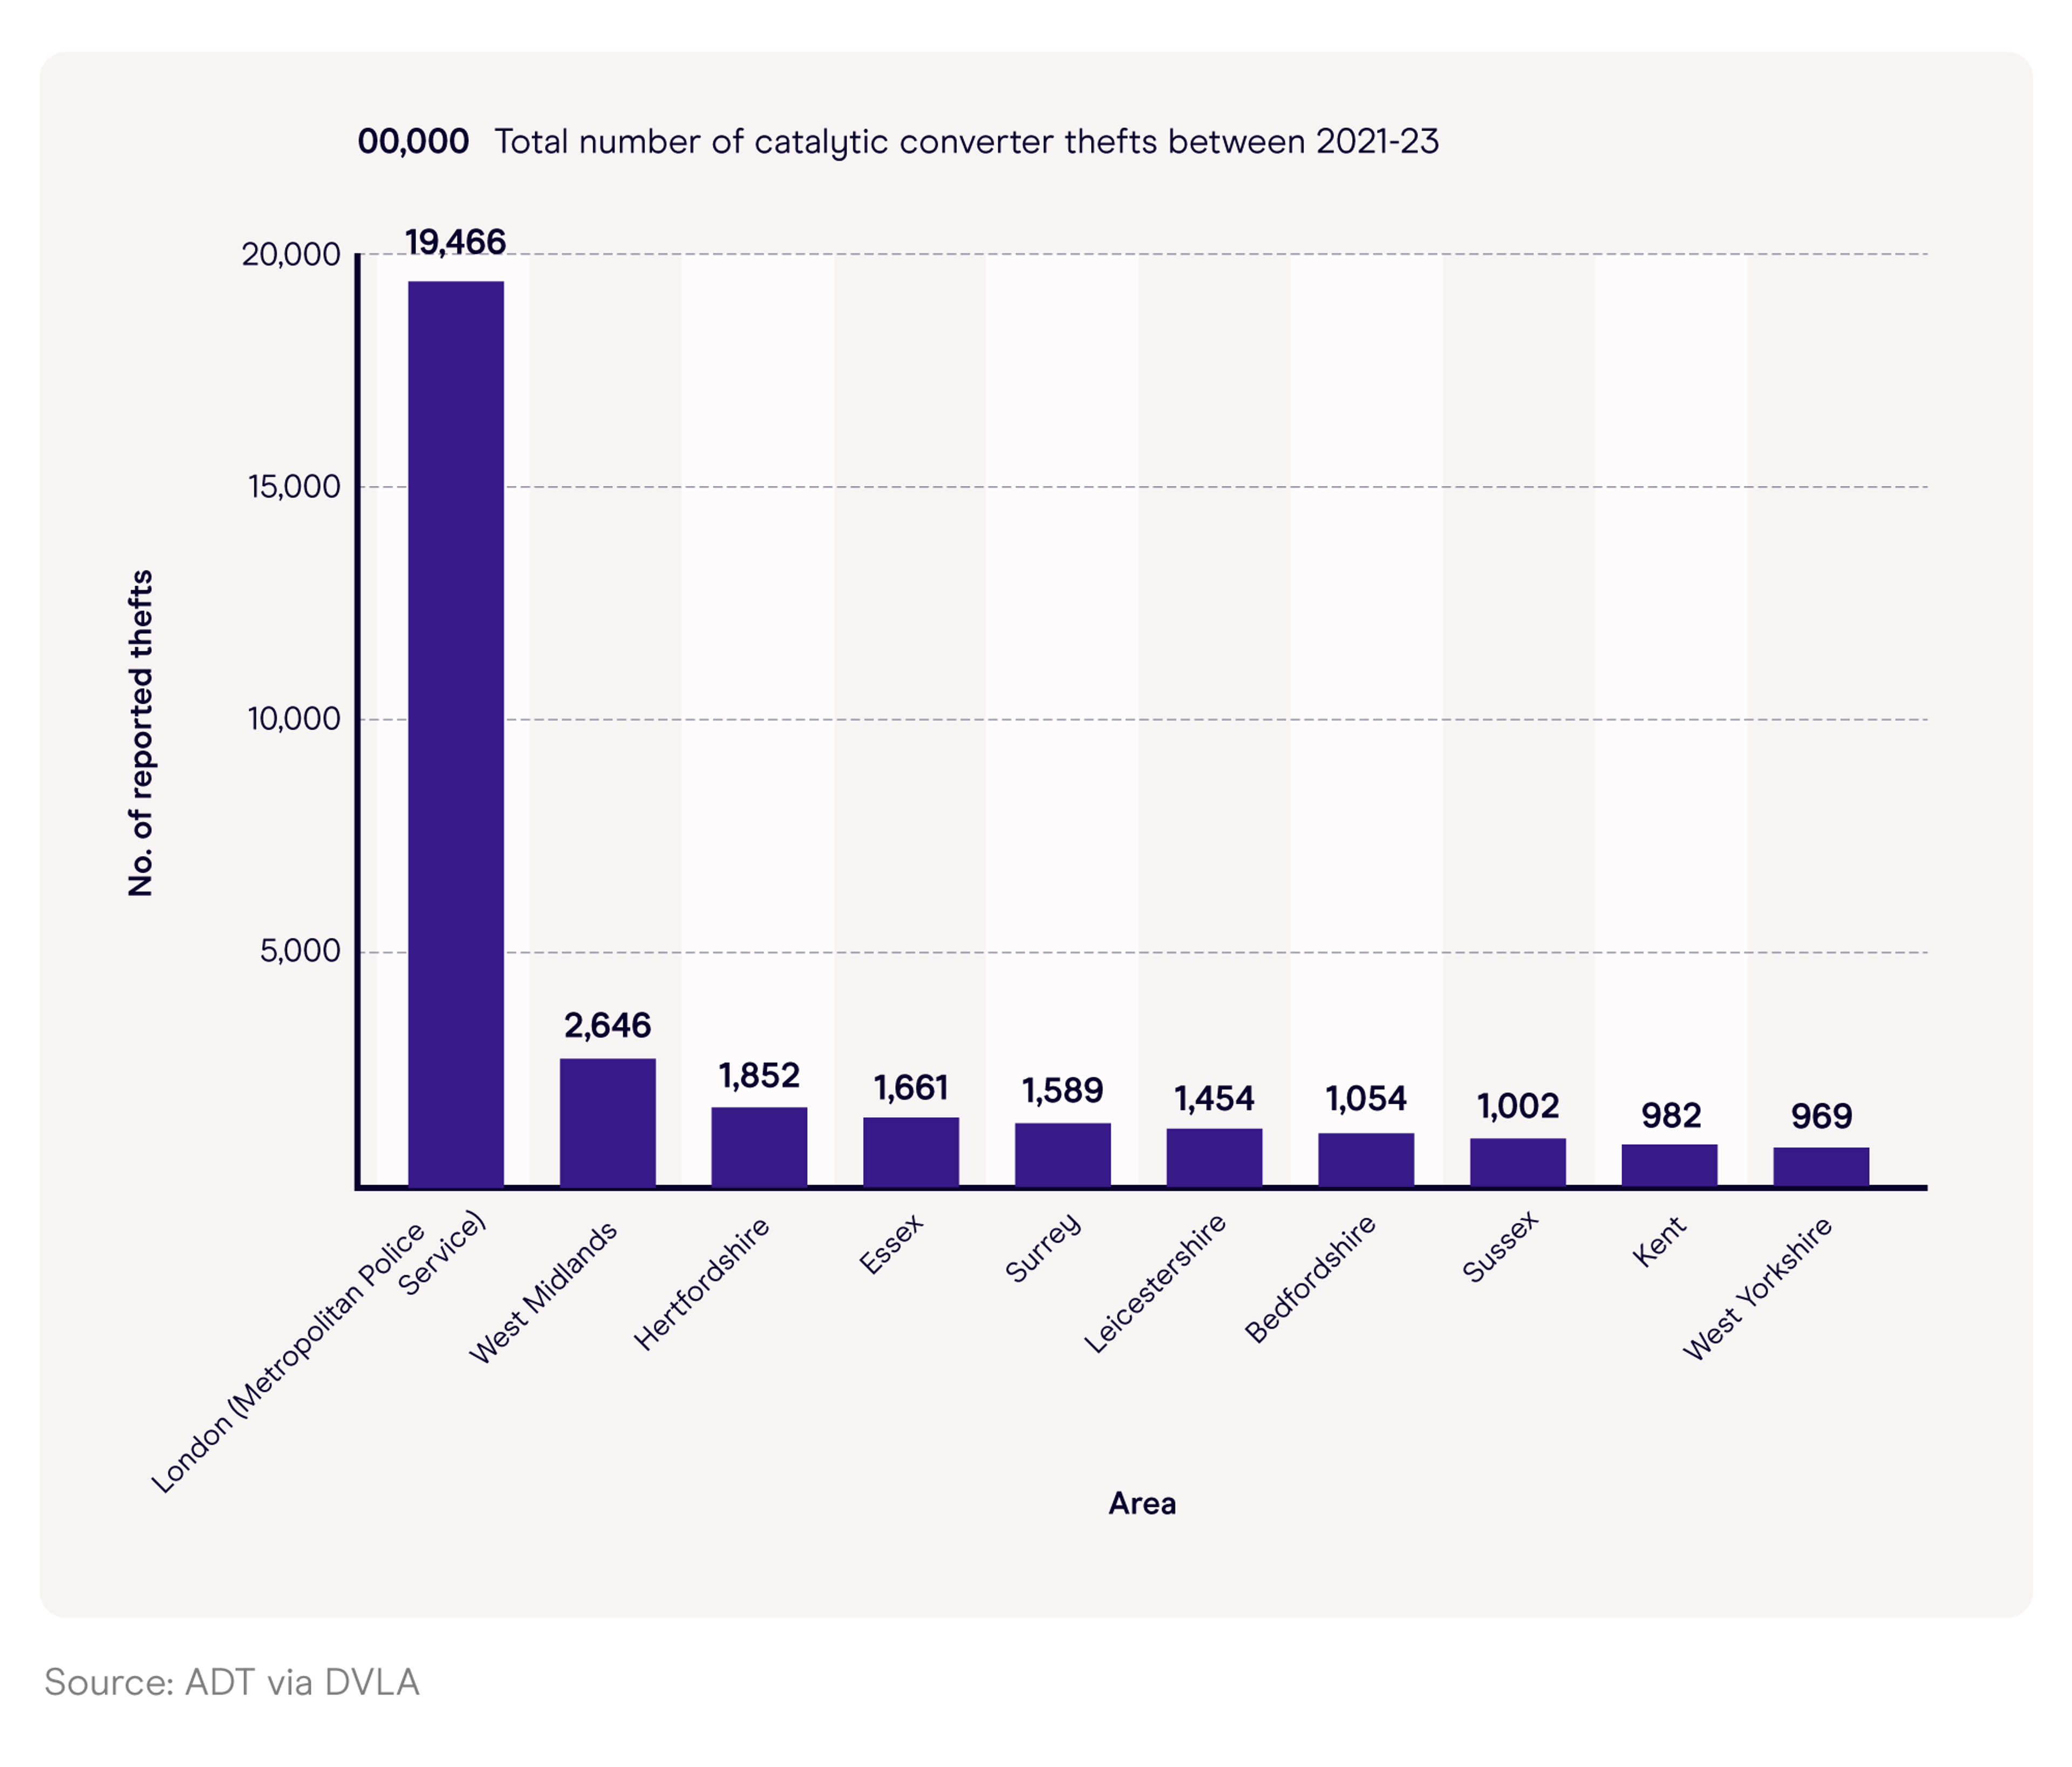
^ How catalytic converter theft stats have changed in different parts of the UK over time
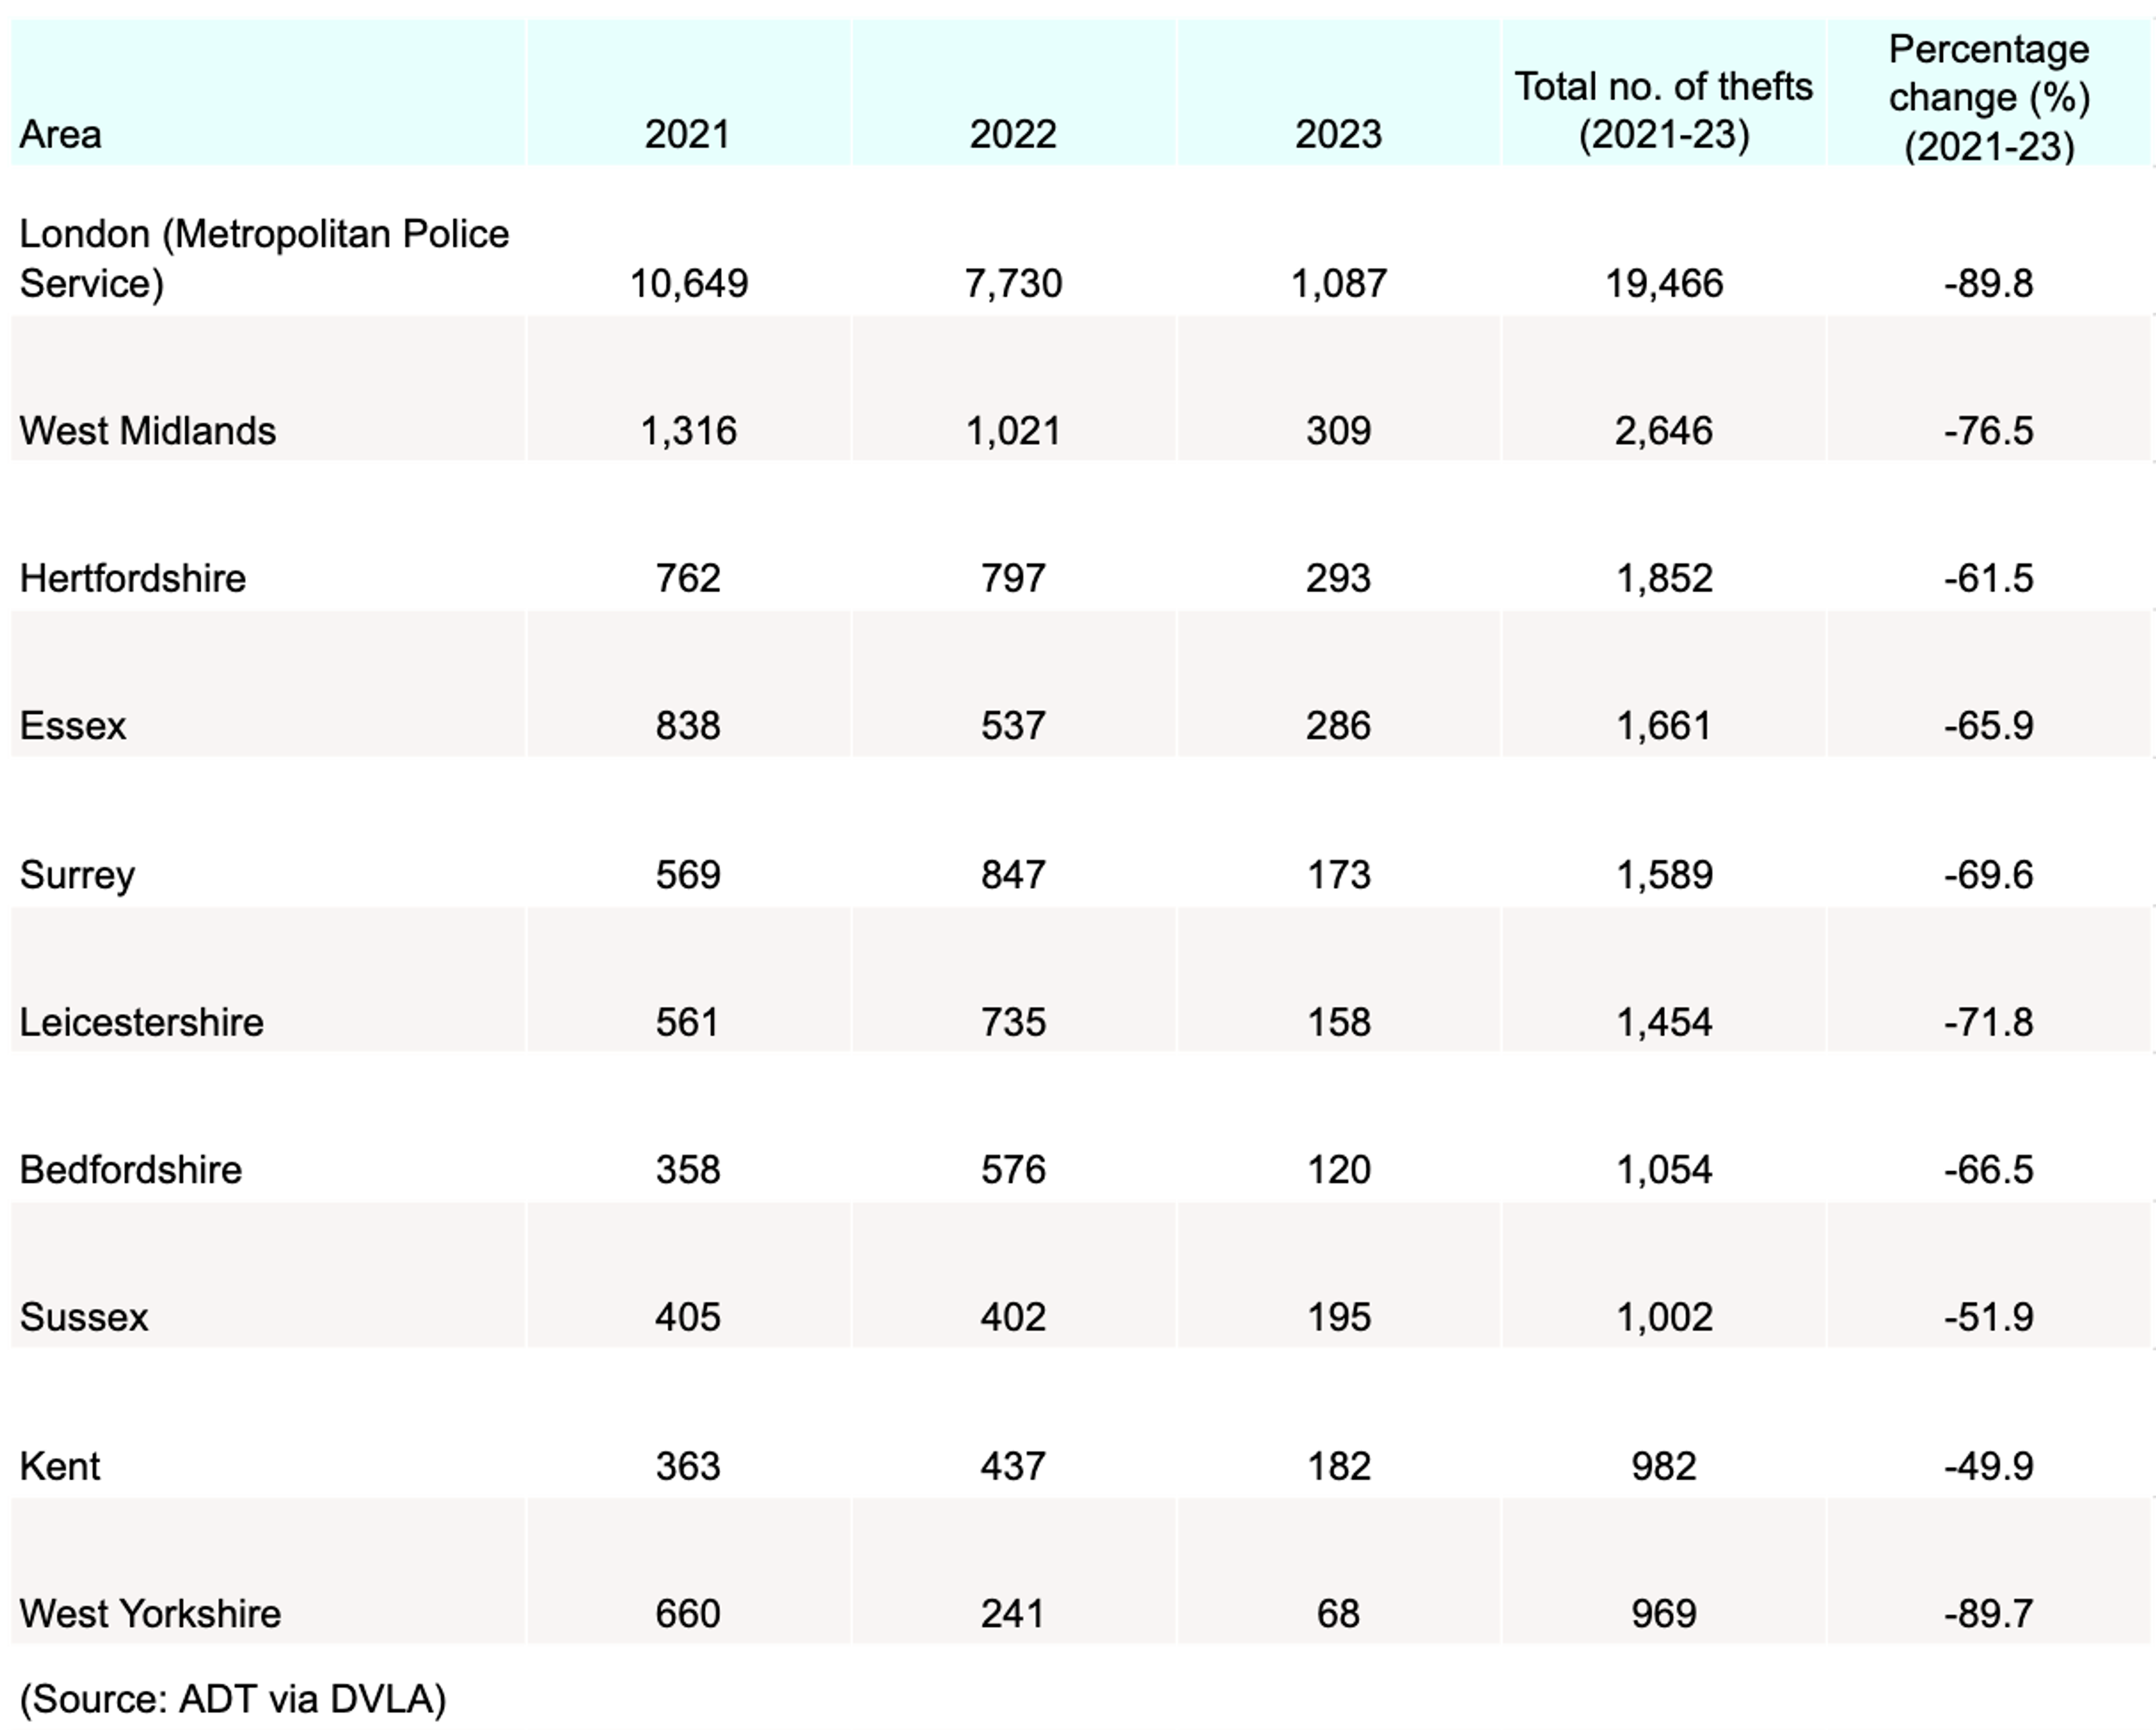
As a result, the percentage change in the total number of catalytic converter thefts across the capital was -89.8% between 2021-23. This number is closely followed by West Yorkshire, which saw rates of catalytic converter theft fall from 660 to 68 in the same period – the lowest reported figure from the DVLA.
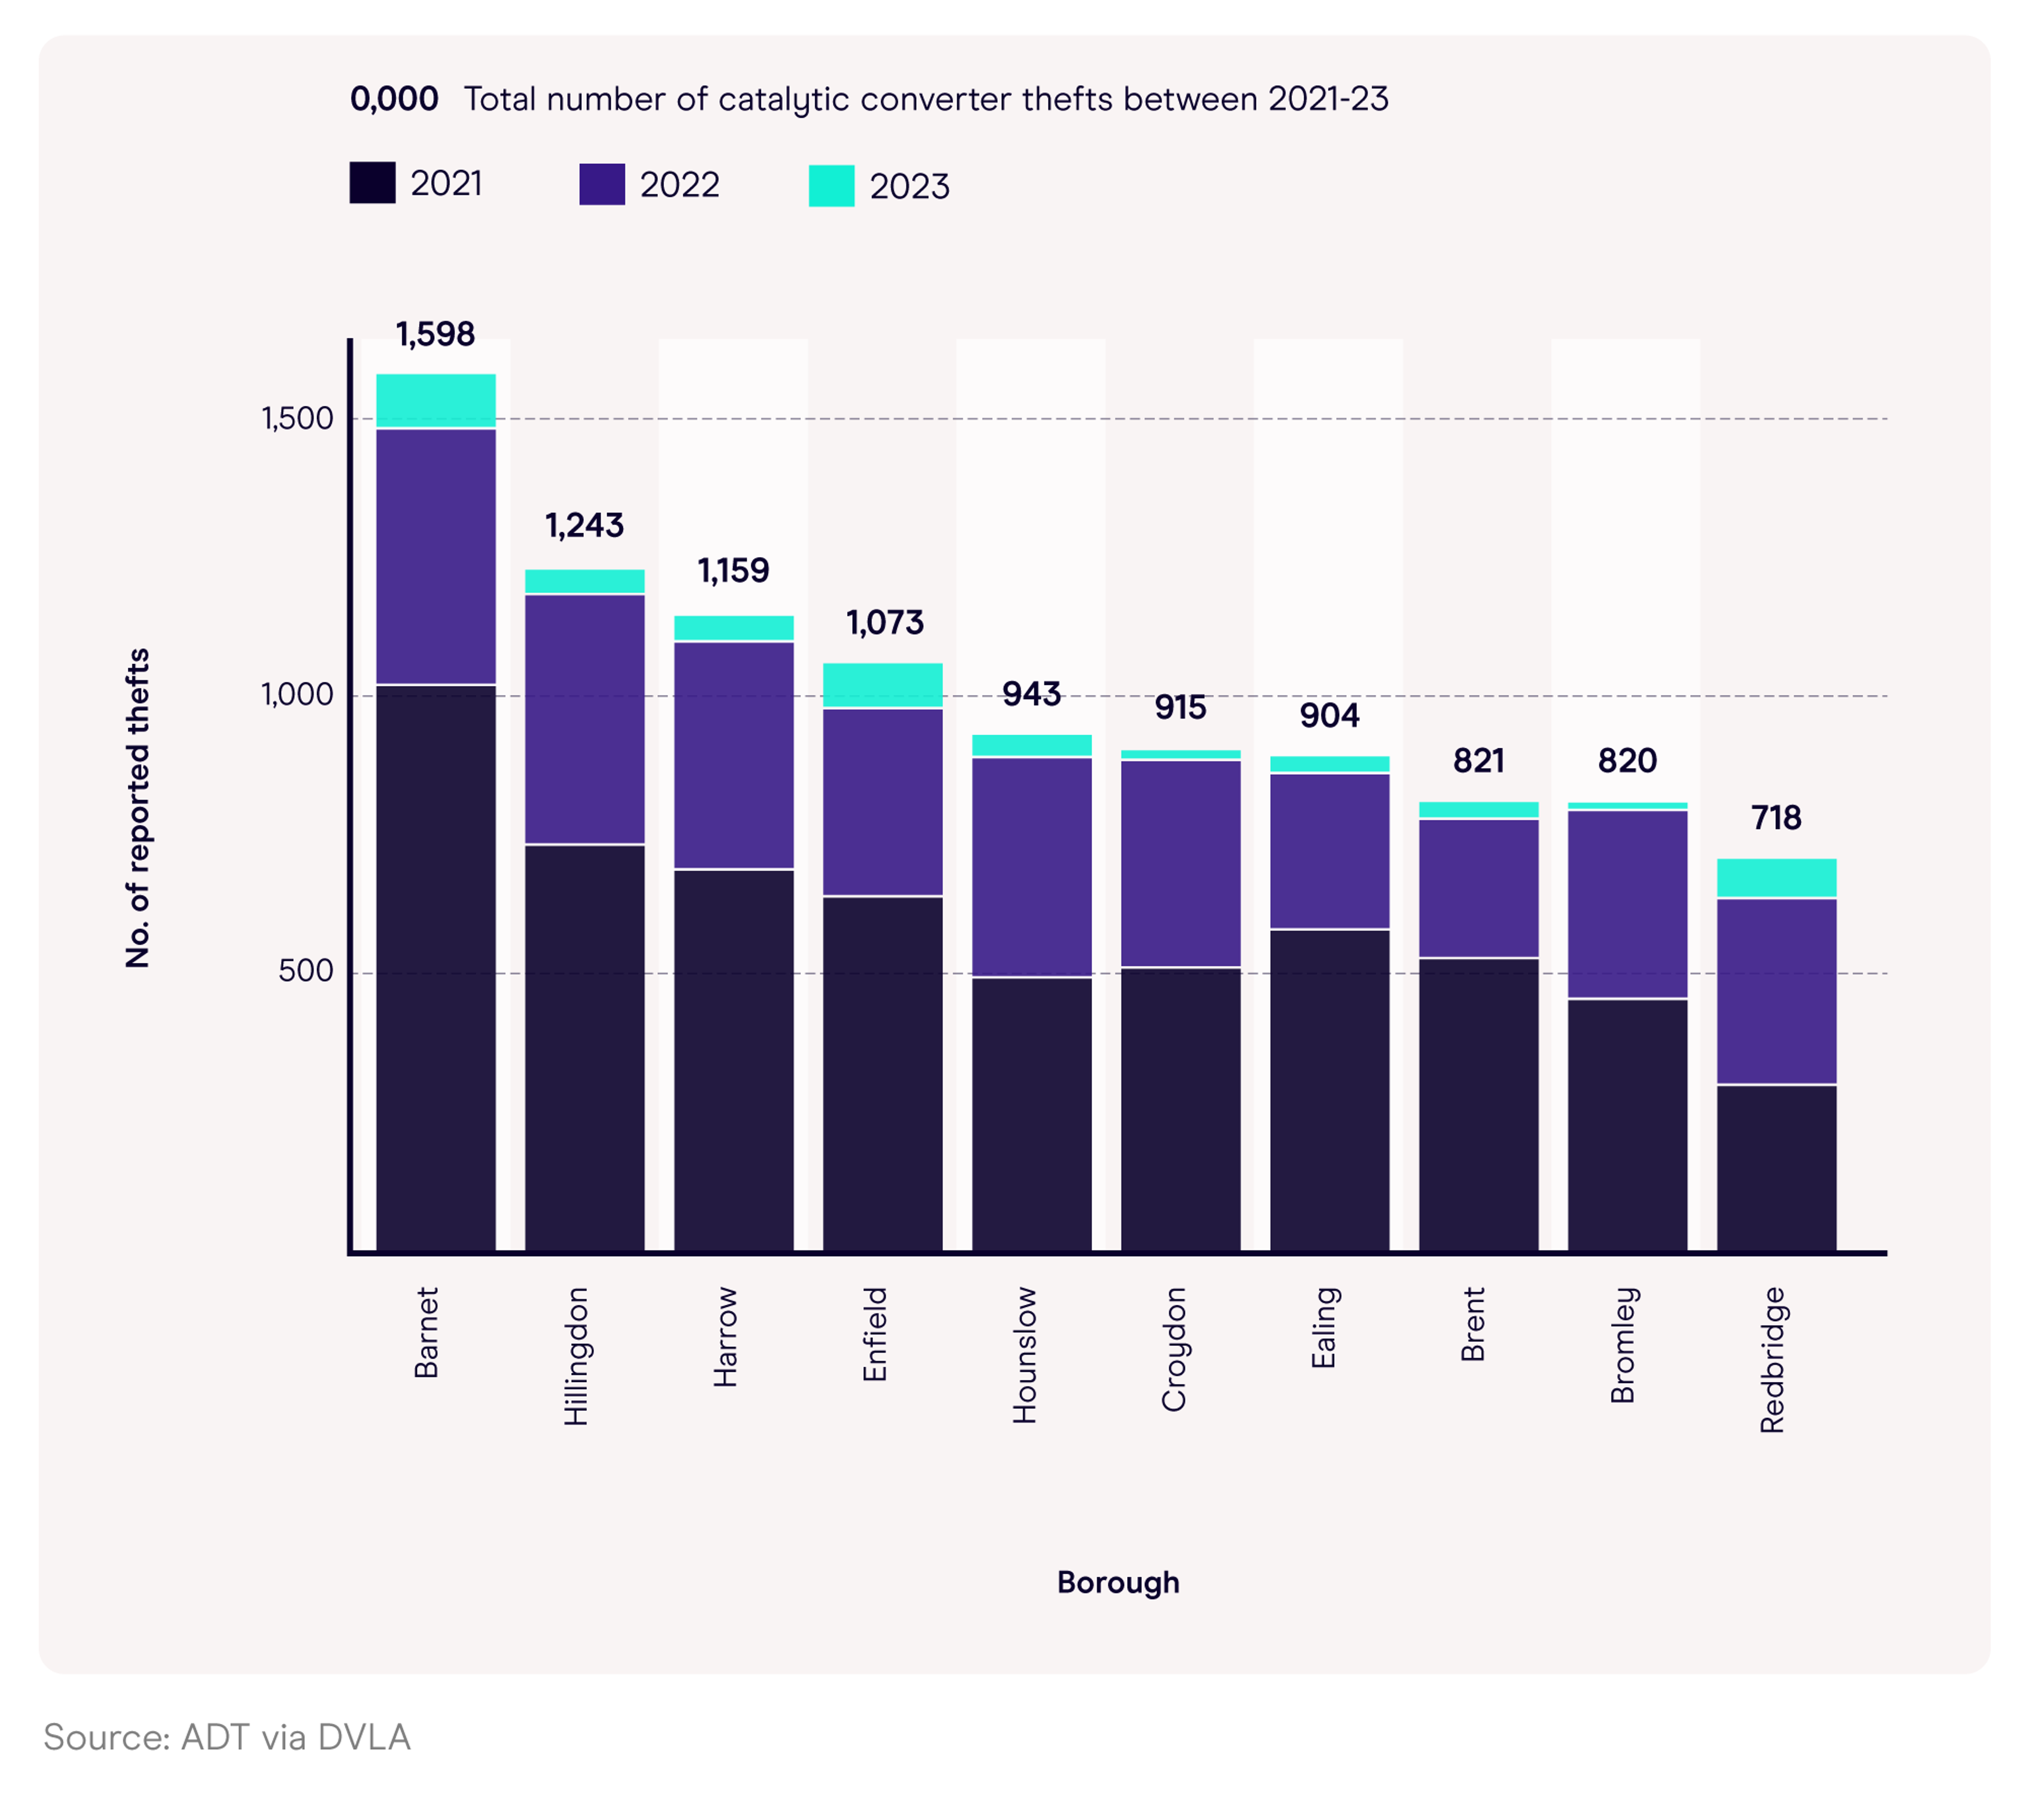
^ Parts of London that have seen the biggest decrease in catalytic converter theft over time
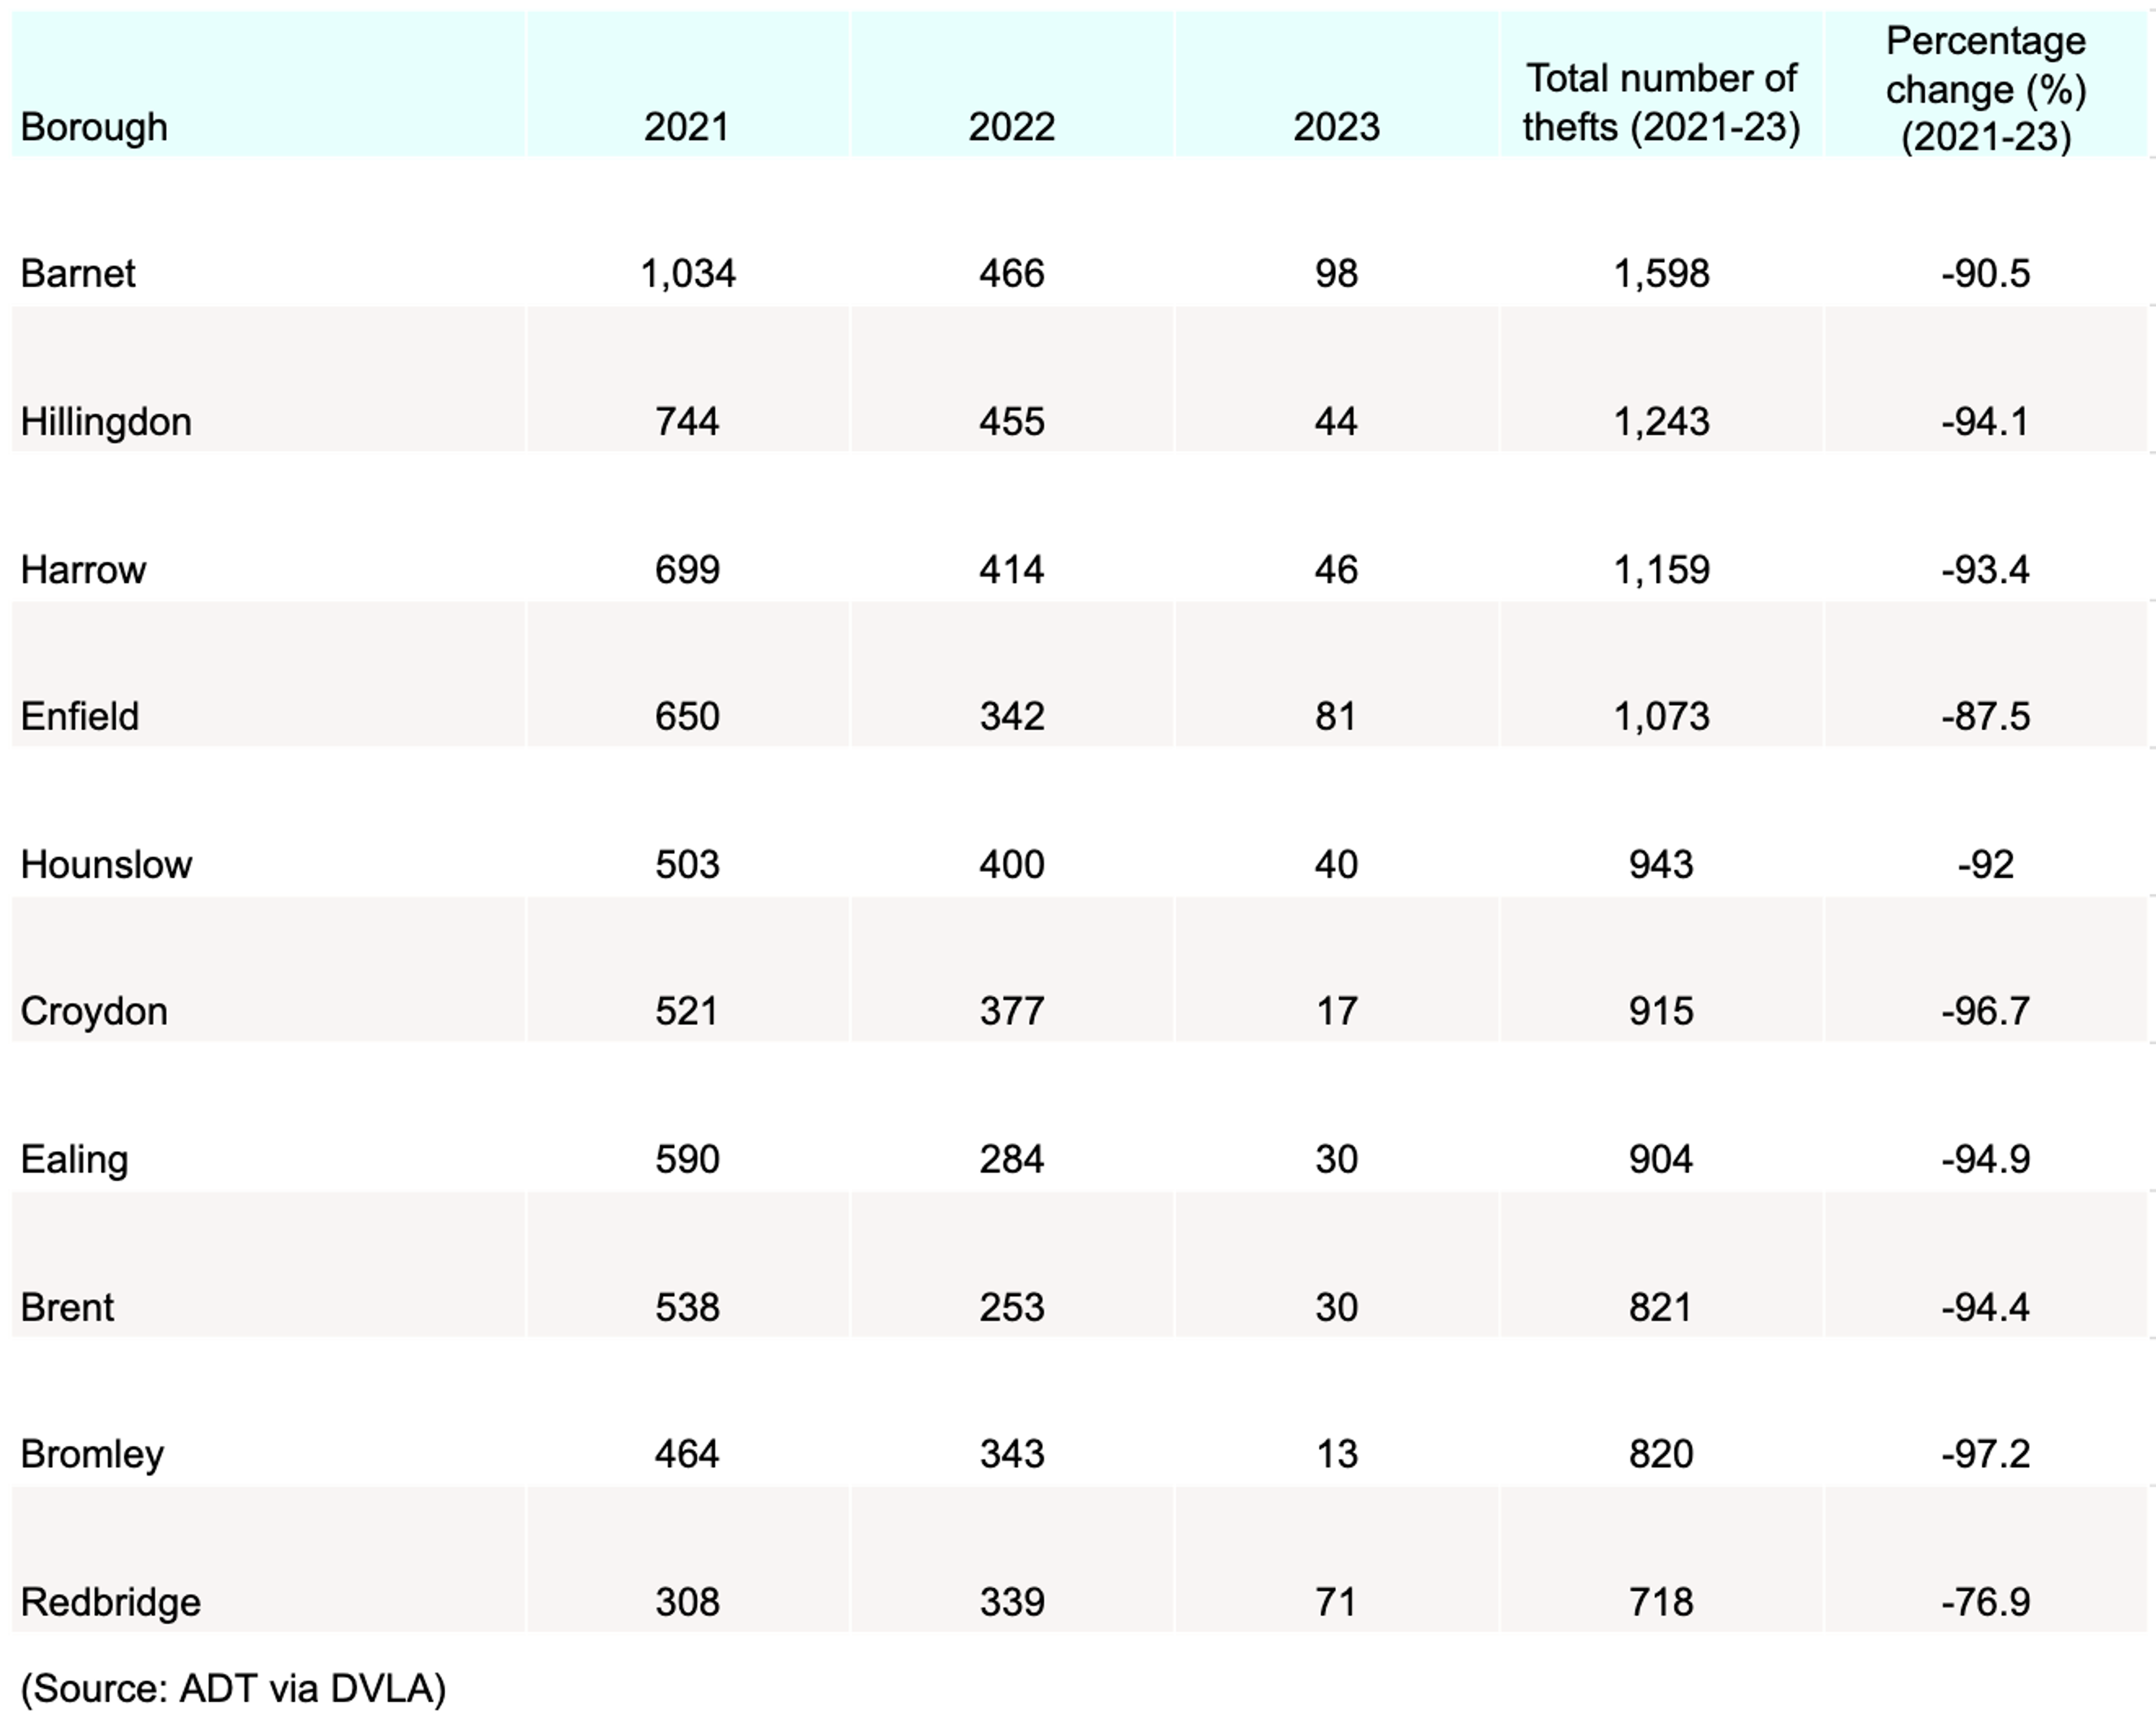
Across London, the number of catalytic converter thefts largely decreased between 2021-23. Vehicle theft statistics from the DVLA reveal that, during this period, Barnet had the highest number of reported thefts at 1,598, with almost two-thirds (64.7%) coming in 2021 alone. As a result, Barnet saw a drop of 90.5% in the reported number of stolen catalytic converters between 2021 and 2023.
Hillingdon reported the second-highest number of catalytic converter thefts in the capital between 2021-23 at 1,243 – around a quarter (25%) less than Barnet. Yet, its year-on-year figures dropped by 94.1% during this period, from 744 down to 44.
Of the top 10 London boroughs for reported catalytic converter theft, Bromley witnessed the largest percentage drop between 2021-23 (-97.2%) to just 13 recorded cases in 2023 – the lowest figure across all 10 areas of the capital in the ADT study.
Public opinion of vehicle theft
Emotional impact of vehicle theft
When asked about the extent to which victims of vehicle theft were emotionally affected by this incident, around two-fifths (43%) in 2022-23 were impacted a little, with just under a third (32%) not affected at all.
In the same year, less than a fifth (17%) claimed to be emotionally impacted ‘quite a lot,’ with less than one in 10 (8%) reporting to be affected ‘very much.’
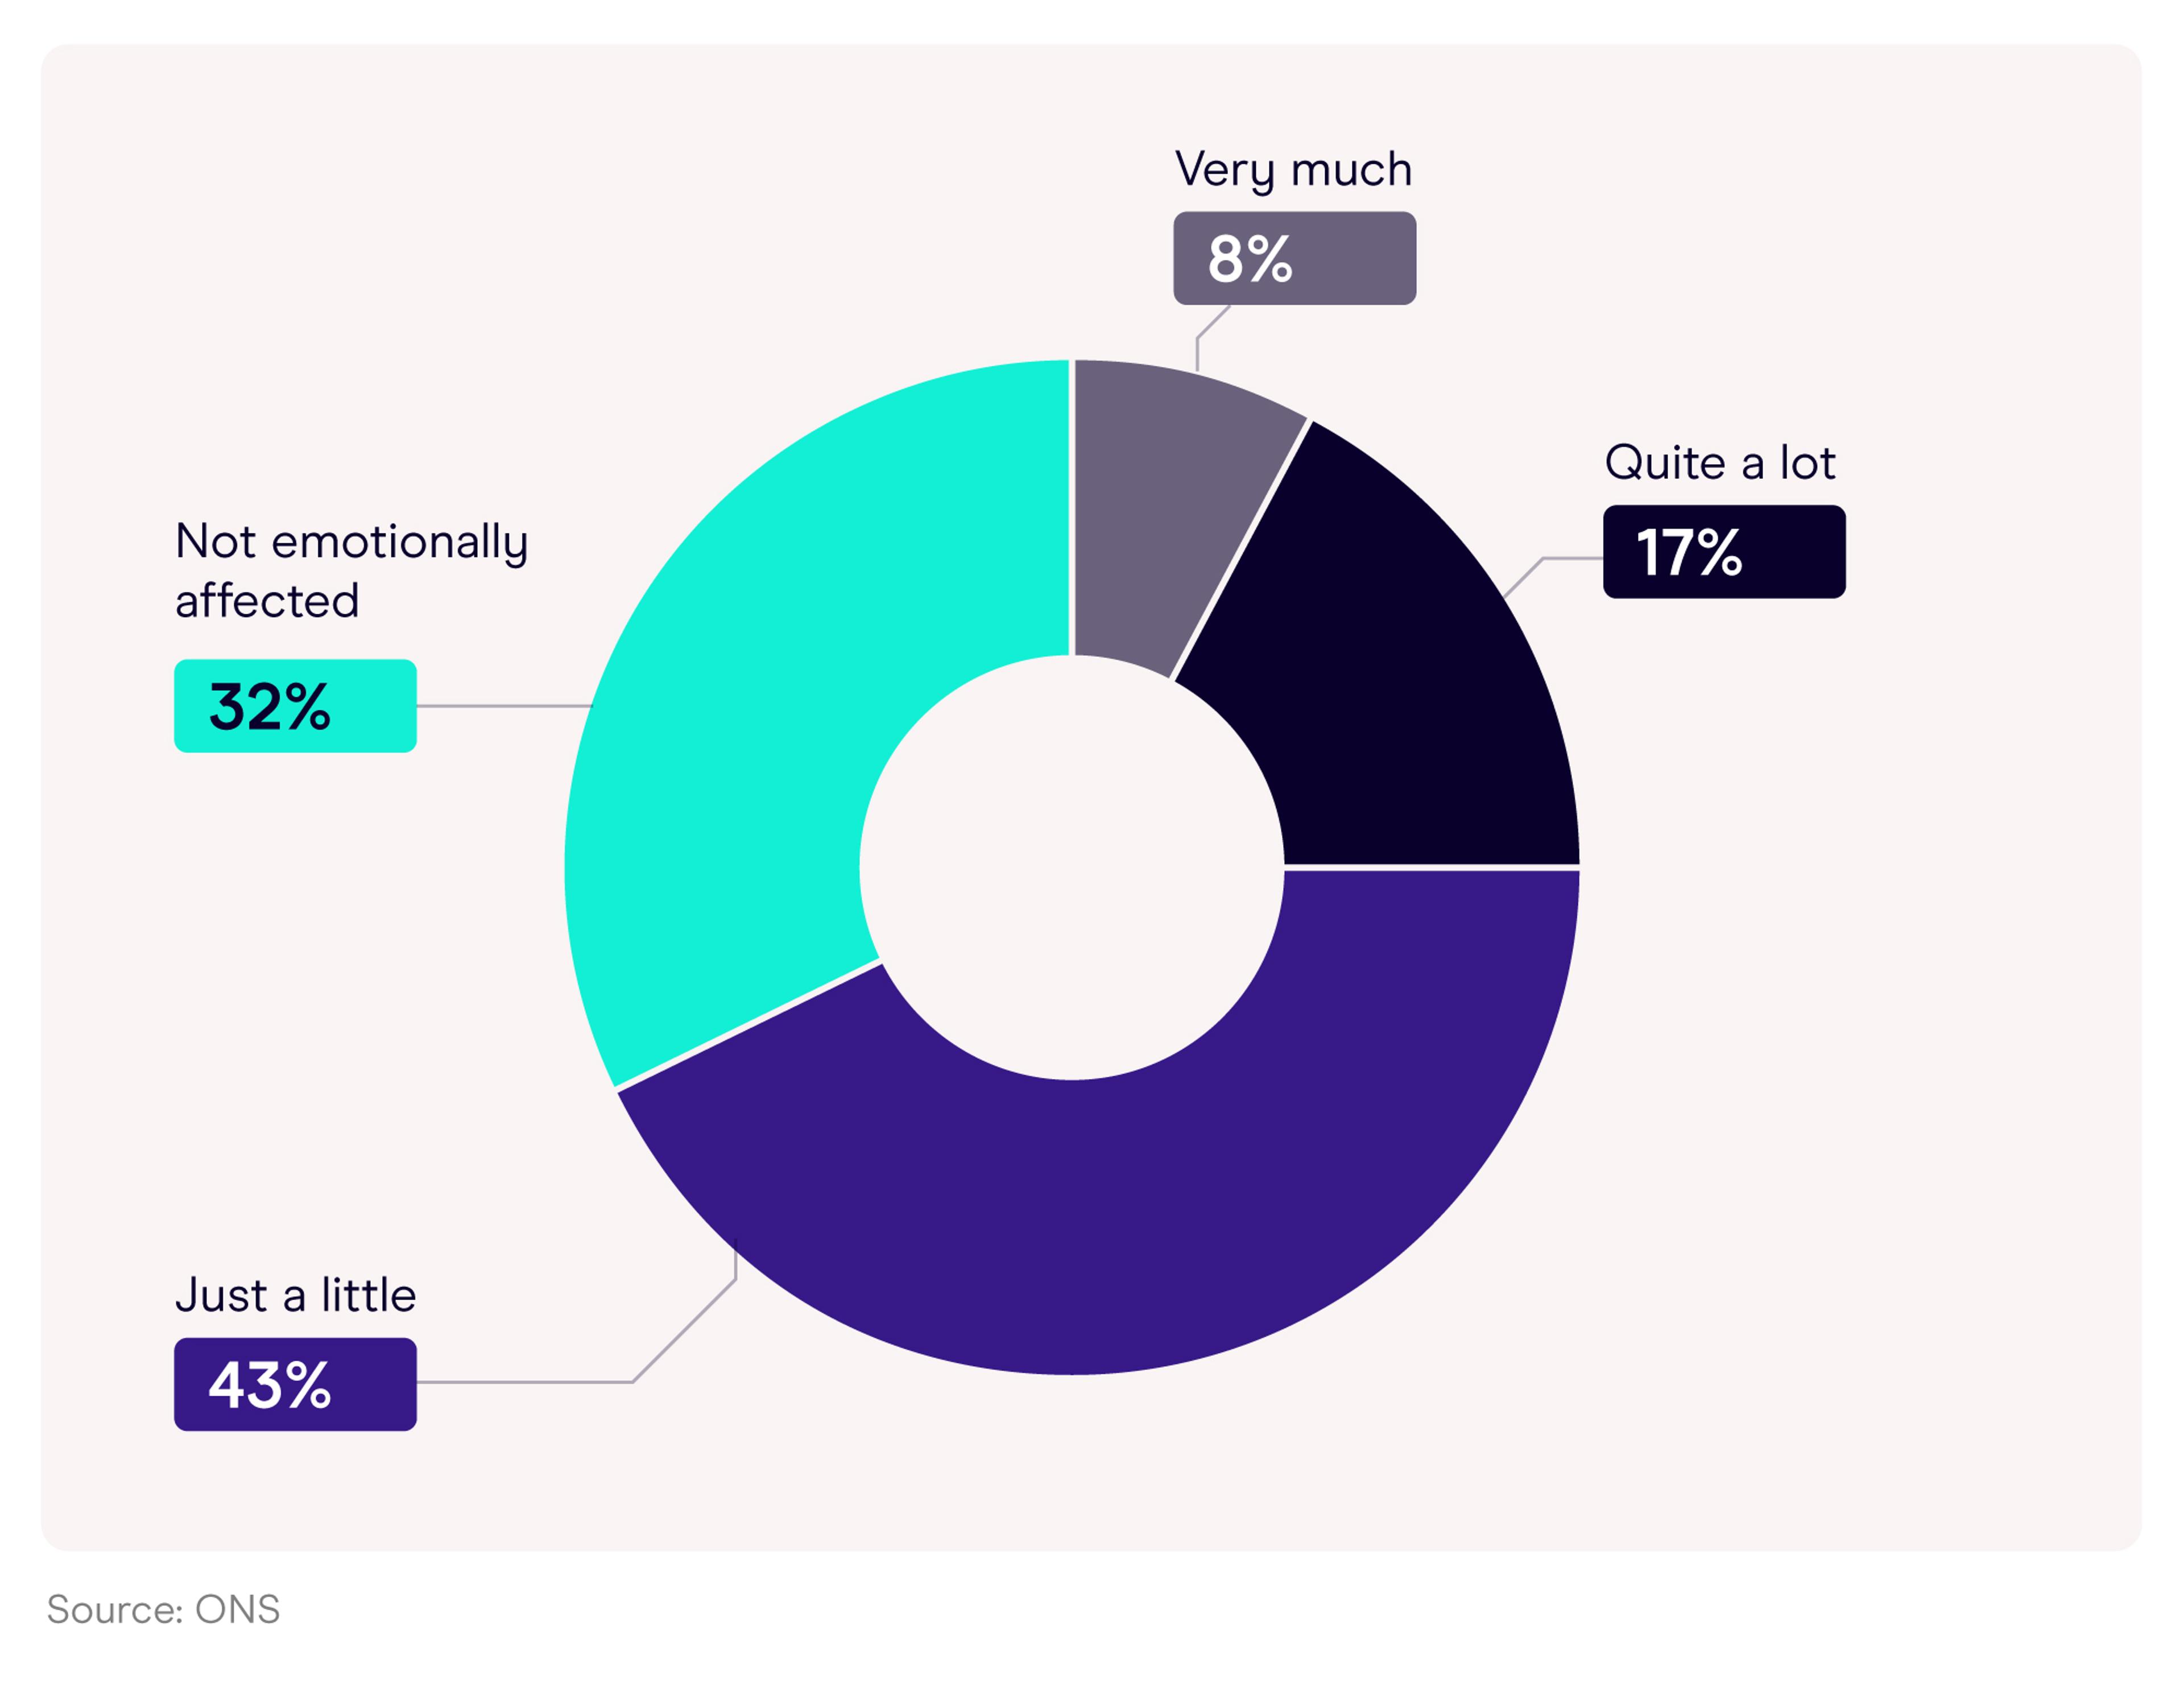
^ Extent to which people have been emotionally affected by vehicle theft
Note (1): Due to the suspension of the Crime Survey for England and Wales (CSEW), data are not available for the years ending March 2021 and March 2022.
Note (2): Total figures for each year may not equal 100% due to rounding.
The proportion of people not emotionally affected by vehicle theft fluctuated between 2012-23 from less than a fifth (18%) in 2018-19 up to a peak of almost a third (32%) in 2015-26 and 2022-23.
Those affected ‘very much’ as victims of vehicle theft did not exceed 10% in the previous 10 years, with the proportion impacted ‘quite a lot’ reaching almost a quarter (24%) of those surveyed in 2021-13. Incidentally, those affected a little bit emotionally by the experience drifted between more than half (54%) in 2013-14 down to just over two-fifths (43%) in 2015-16 and 2022-23.
This implies that the majority of people are shaken up a little from being victims of vehicle theft but that the experience is generally not hugely damaging to their emotional state as a result of having their car stolen.
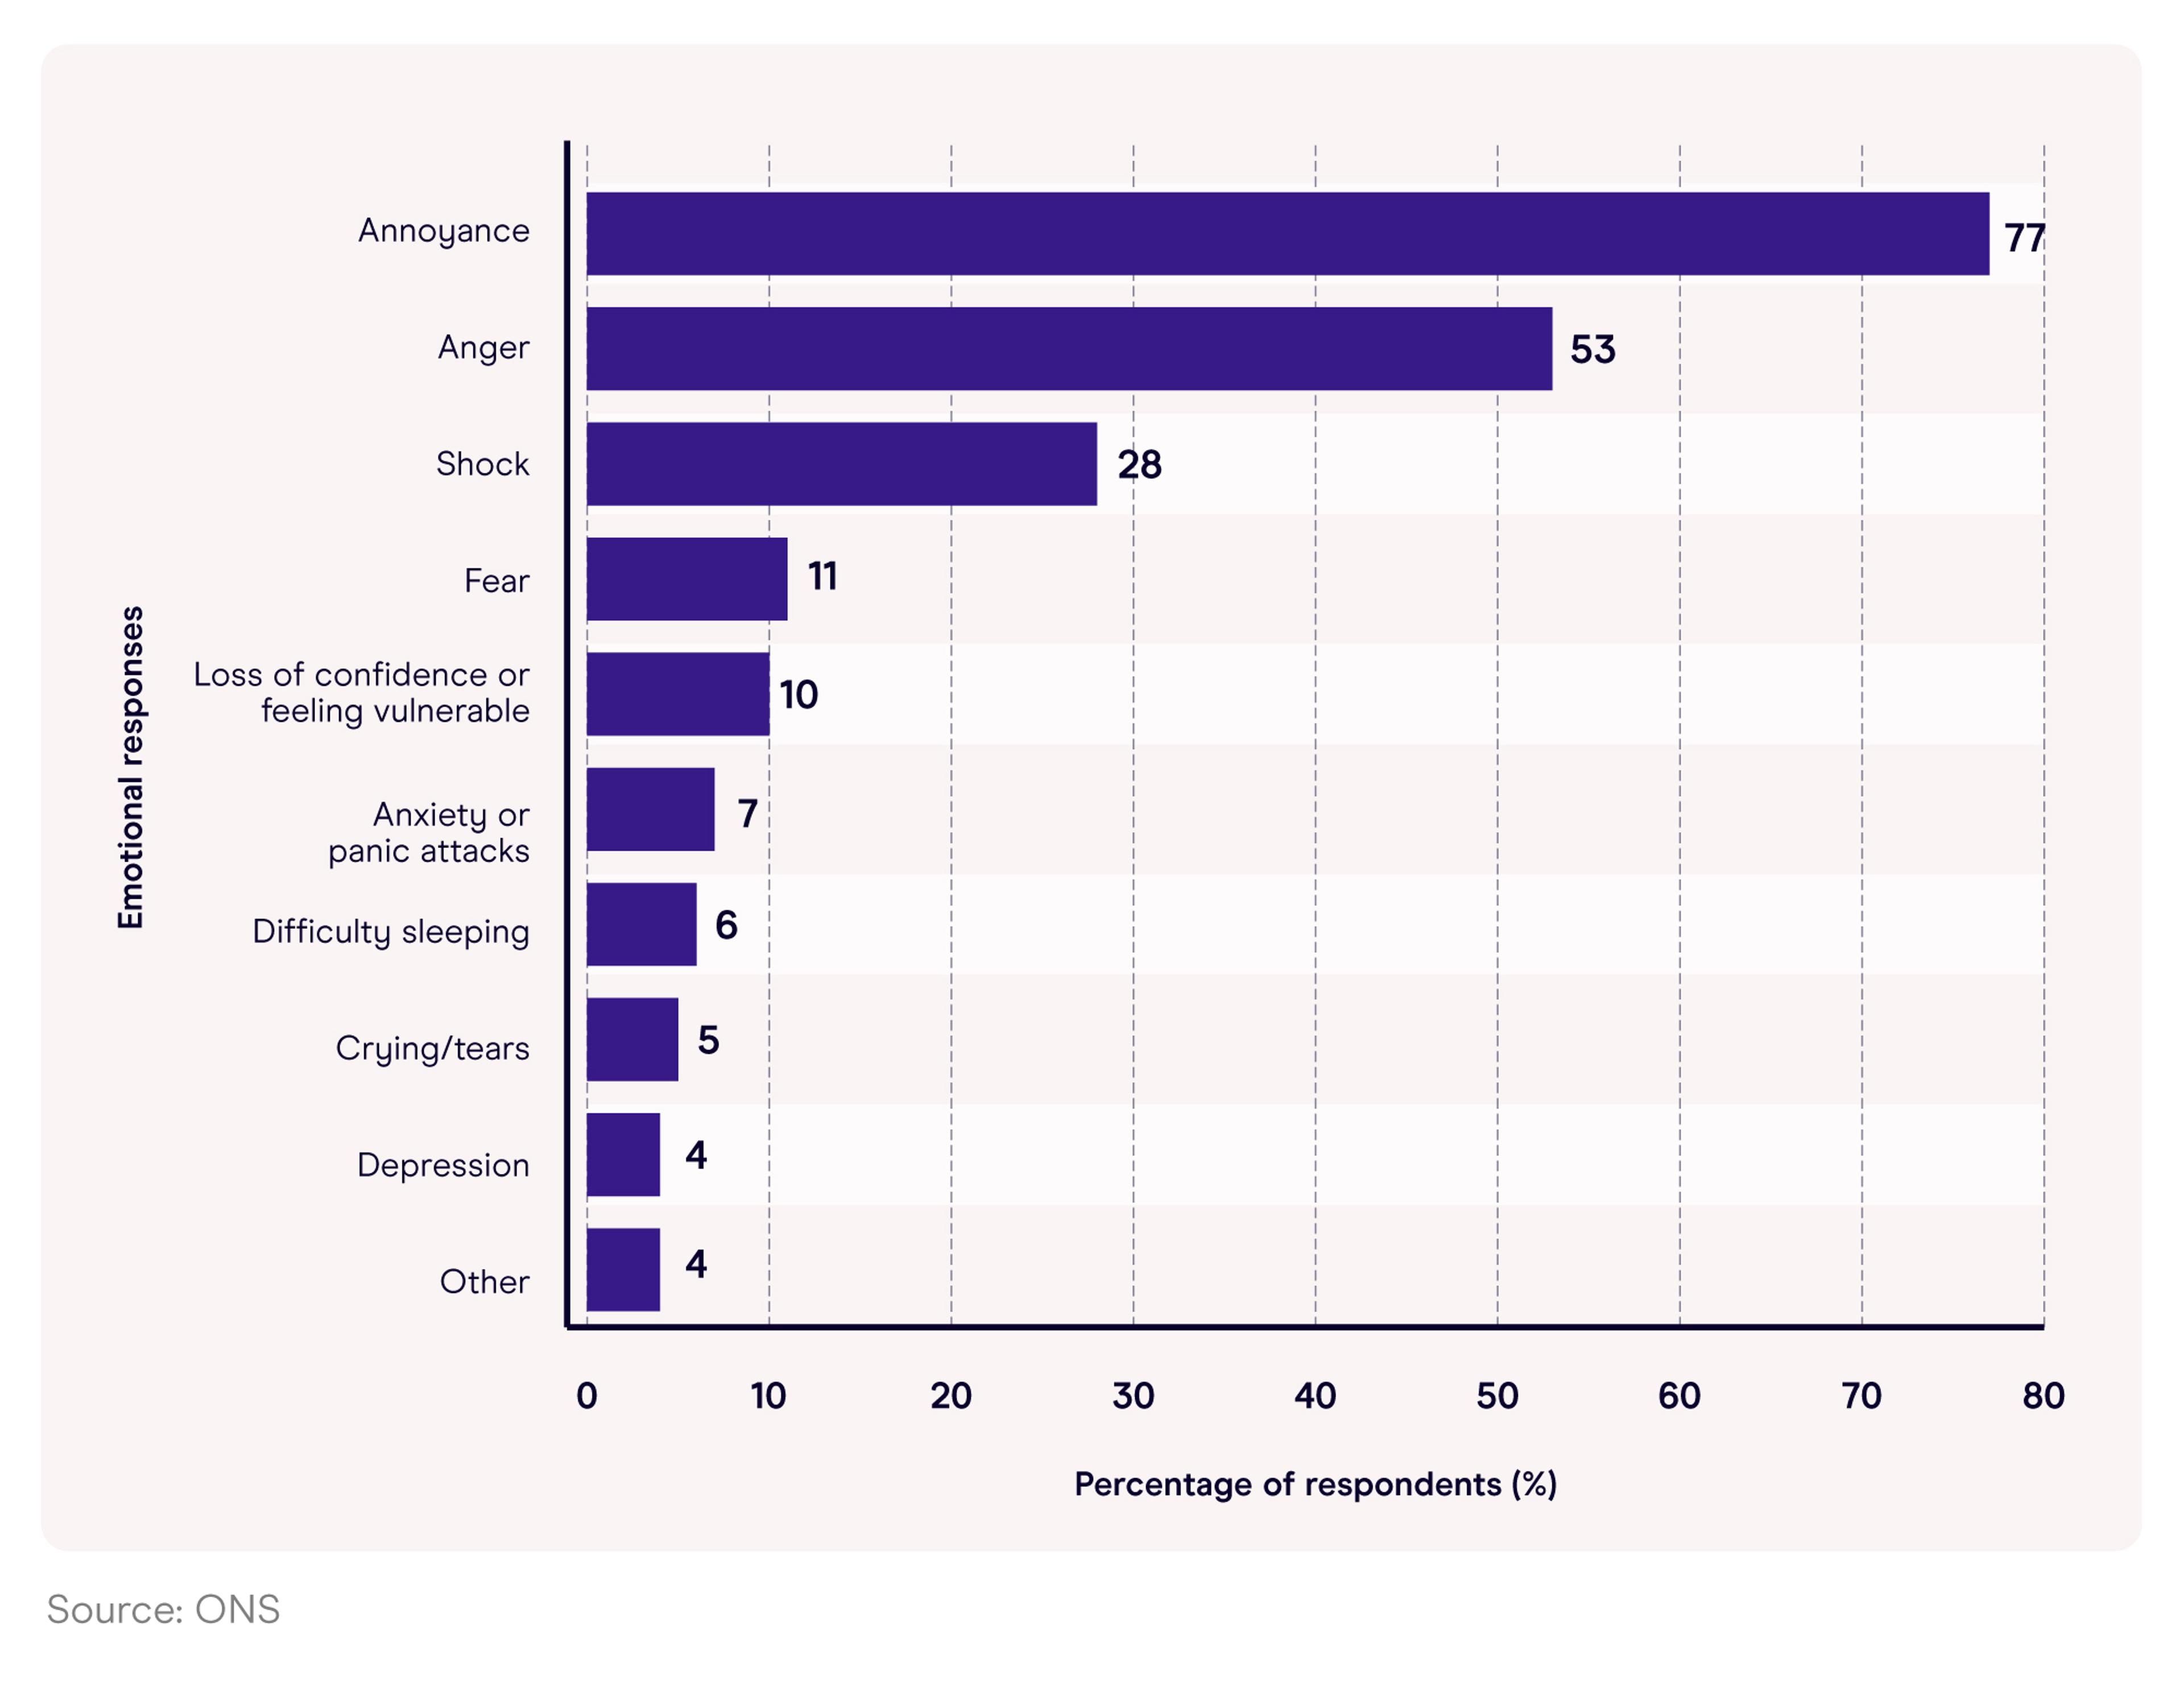
^ Most common emotional responses after experiencing a vehicle theft incident
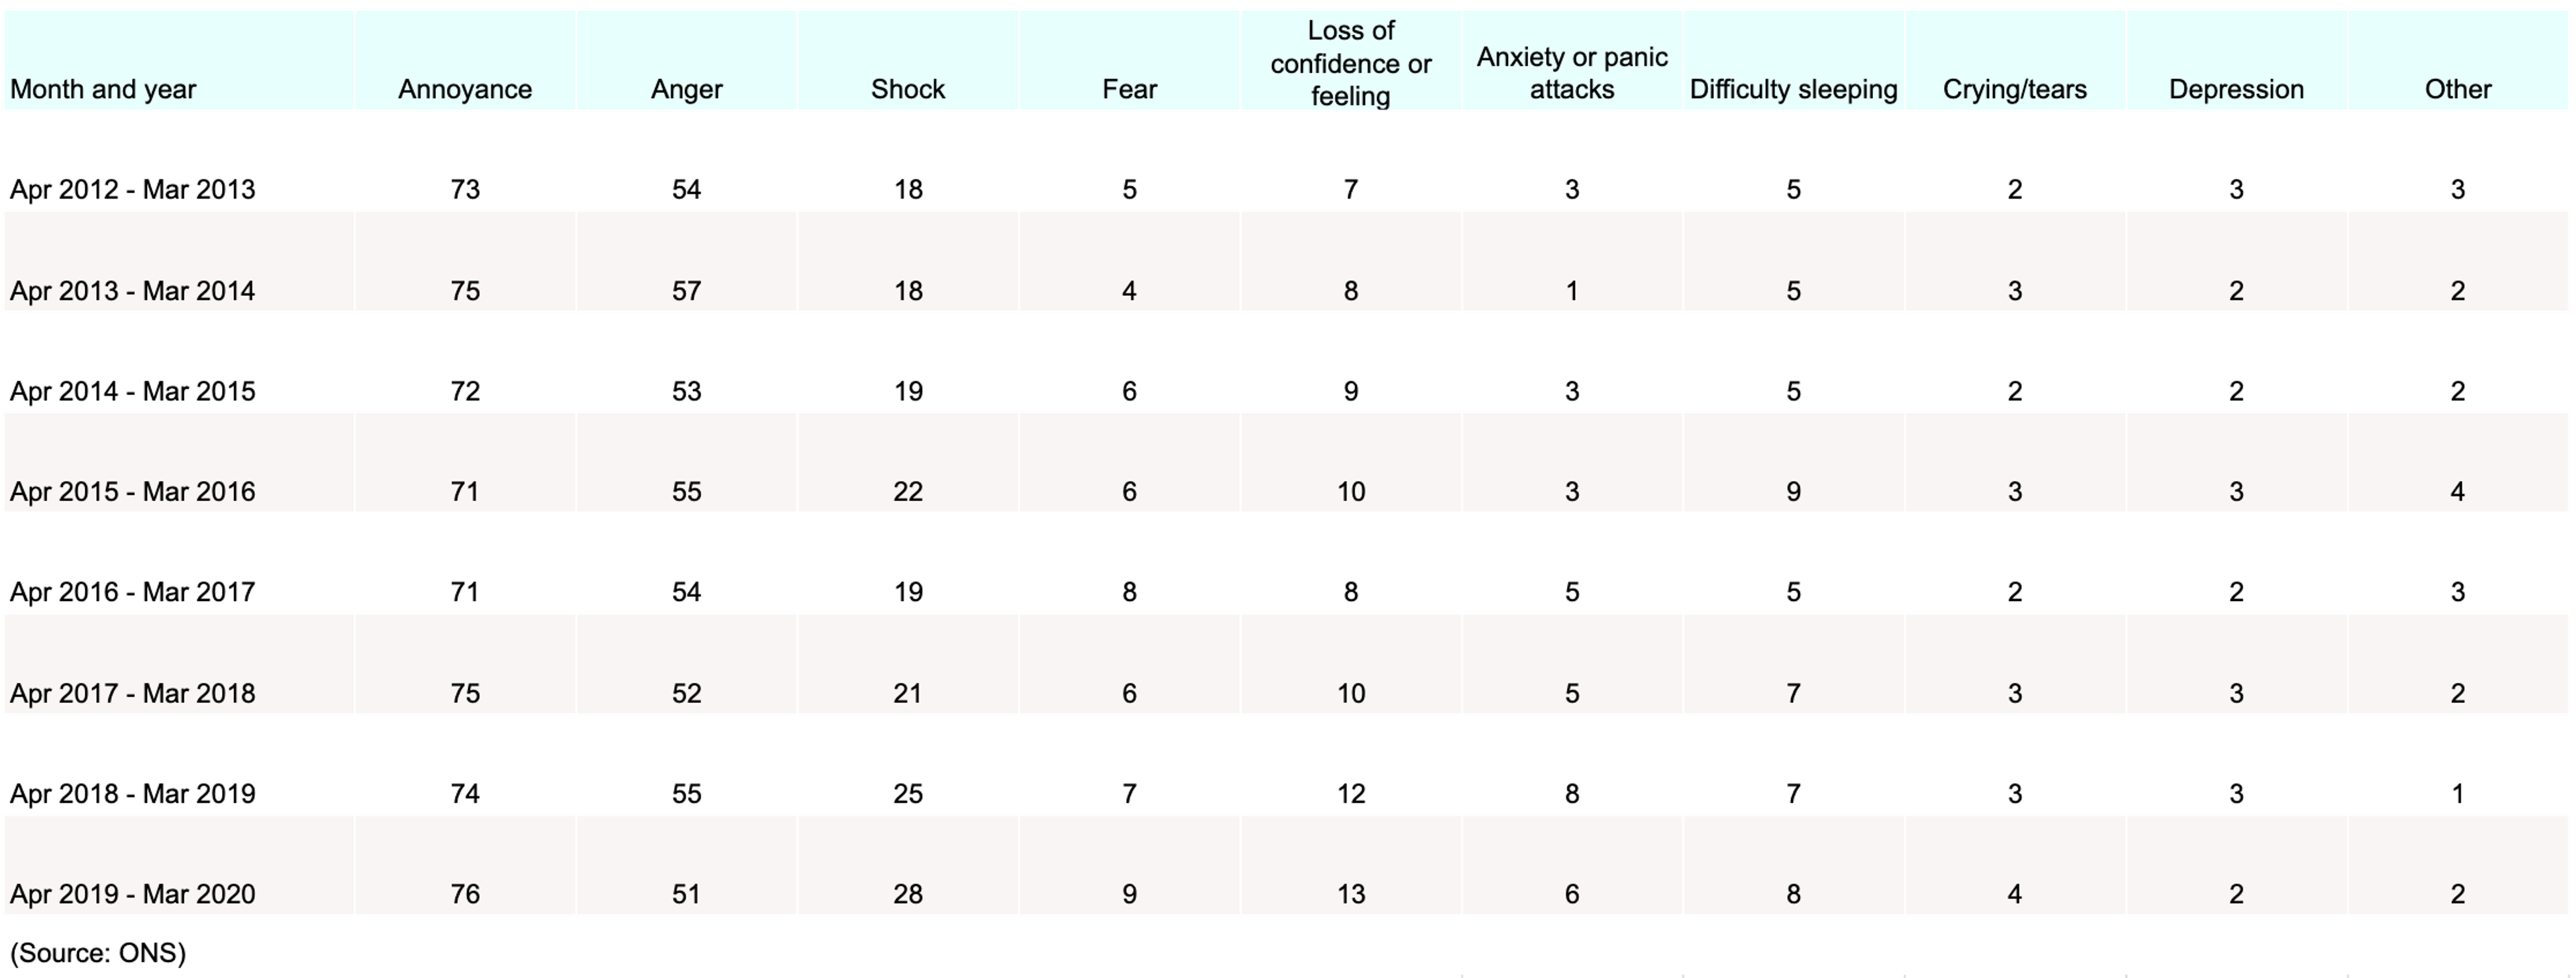
Note: Due to the suspension of the Crime Survey for England and Wales (CSEW), data are not available for the years ending March 2021 and March 2022.
As of 2022-23, the most common emotional response by victims of vehicle theft was that of annoyance, something felt by more than three-quarters (77%) of those surveyed in the ONS’s annual CSEW.
In the same year, just over half (53%) of people were angry at having their vehicle stolen, with more than a quarter (28%) in a state of shock.
These trends have largely prevailed over time, with the percentage of those feeling annoyed fluctuating between 71% in 2015-16 and 2016-17 up to a peak of 77% in 2022-23. Those feeling emotions of anger at having their car stolen also remained above 50% between 2012-23, with those expressing shock increasing by 10 percentage points in the same period.
Perceived seriousness of vehicle theft
When questioned by the ONS as part of their annual CSEW, around nine in 10 (90%) people between April 2022 and March 2023 felt that vehicle theft was a crime. Just 3% of those interviewed believed vehicle theft was wrong but not a crime, with the remaining 7% of the opinion that it’s just “something that happens”.
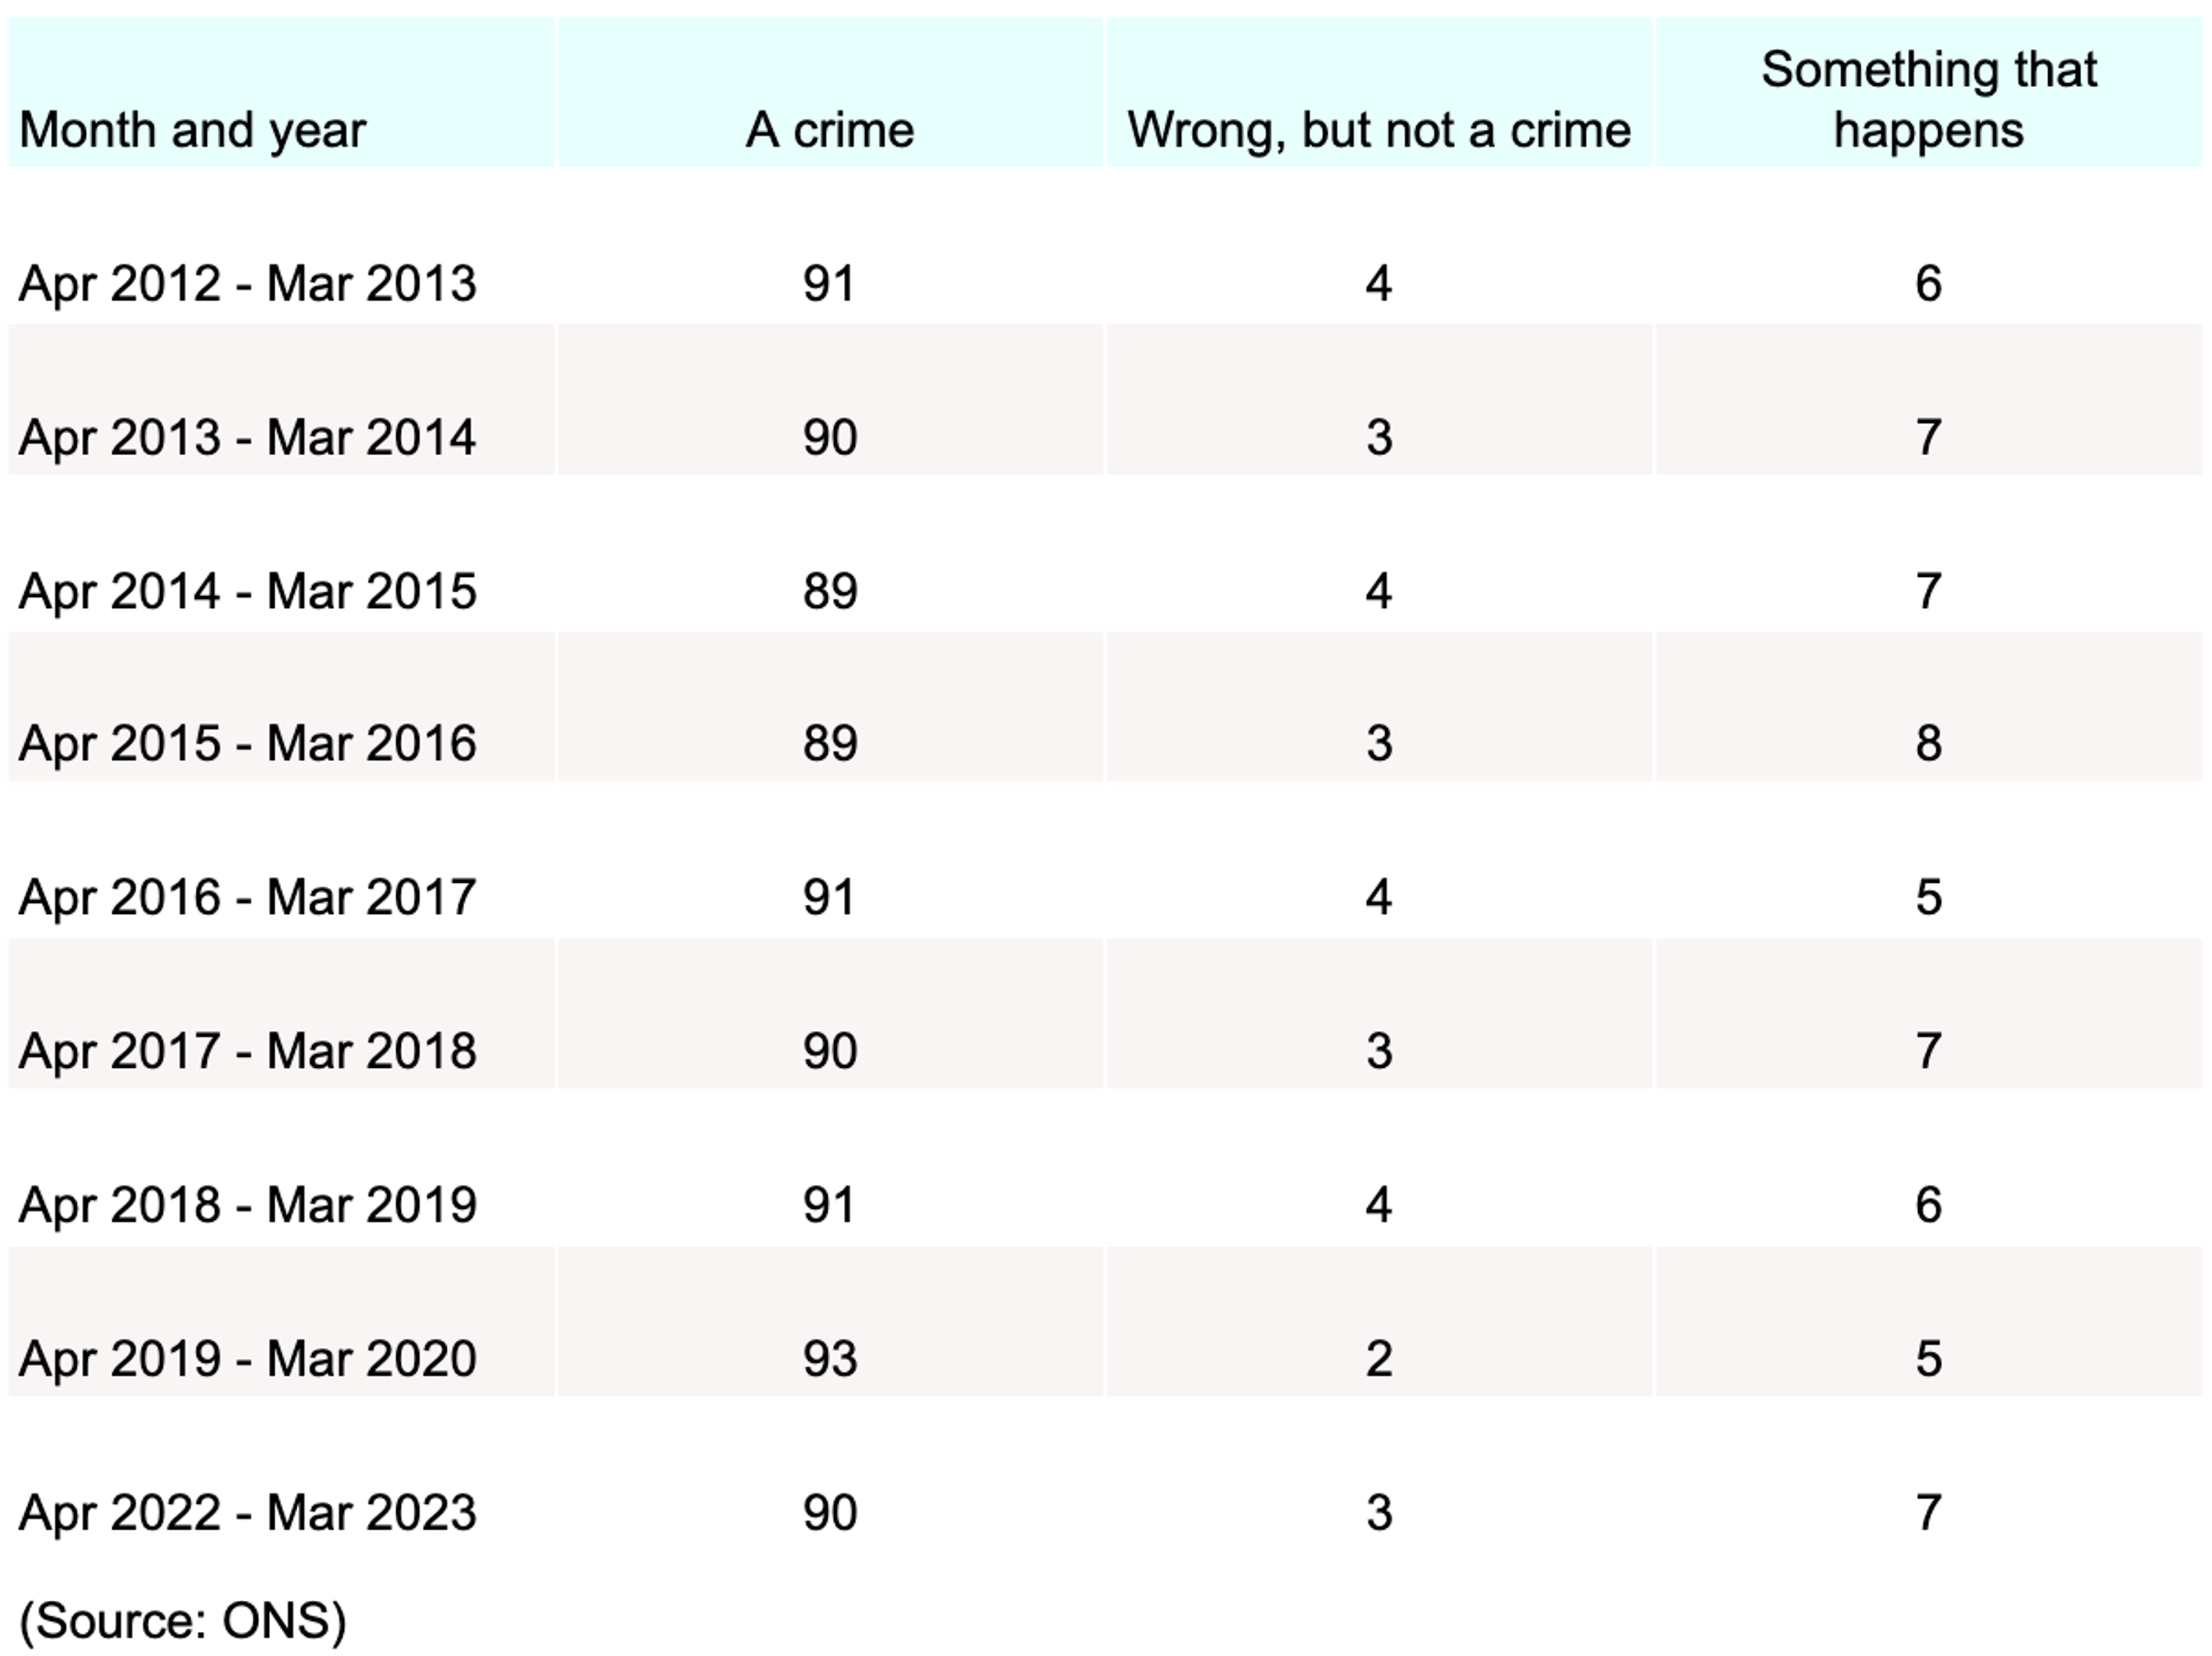
Note: Due to the suspension of the Crime Survey for England and Wales (CSEW), data are not available for the years ending March 2021 and March 2022.
Public opinions around vehicle theft remained largely the same across the previous decade, fluctuating between:
- 89% and 93%, respectively, see vehicle theft as a crime
- 2% and 4%, respectively, believe vehicle theft is wrong but not a criminal offence
- 5% and 8% for those who see vehicle theft as ‘something that happens’.
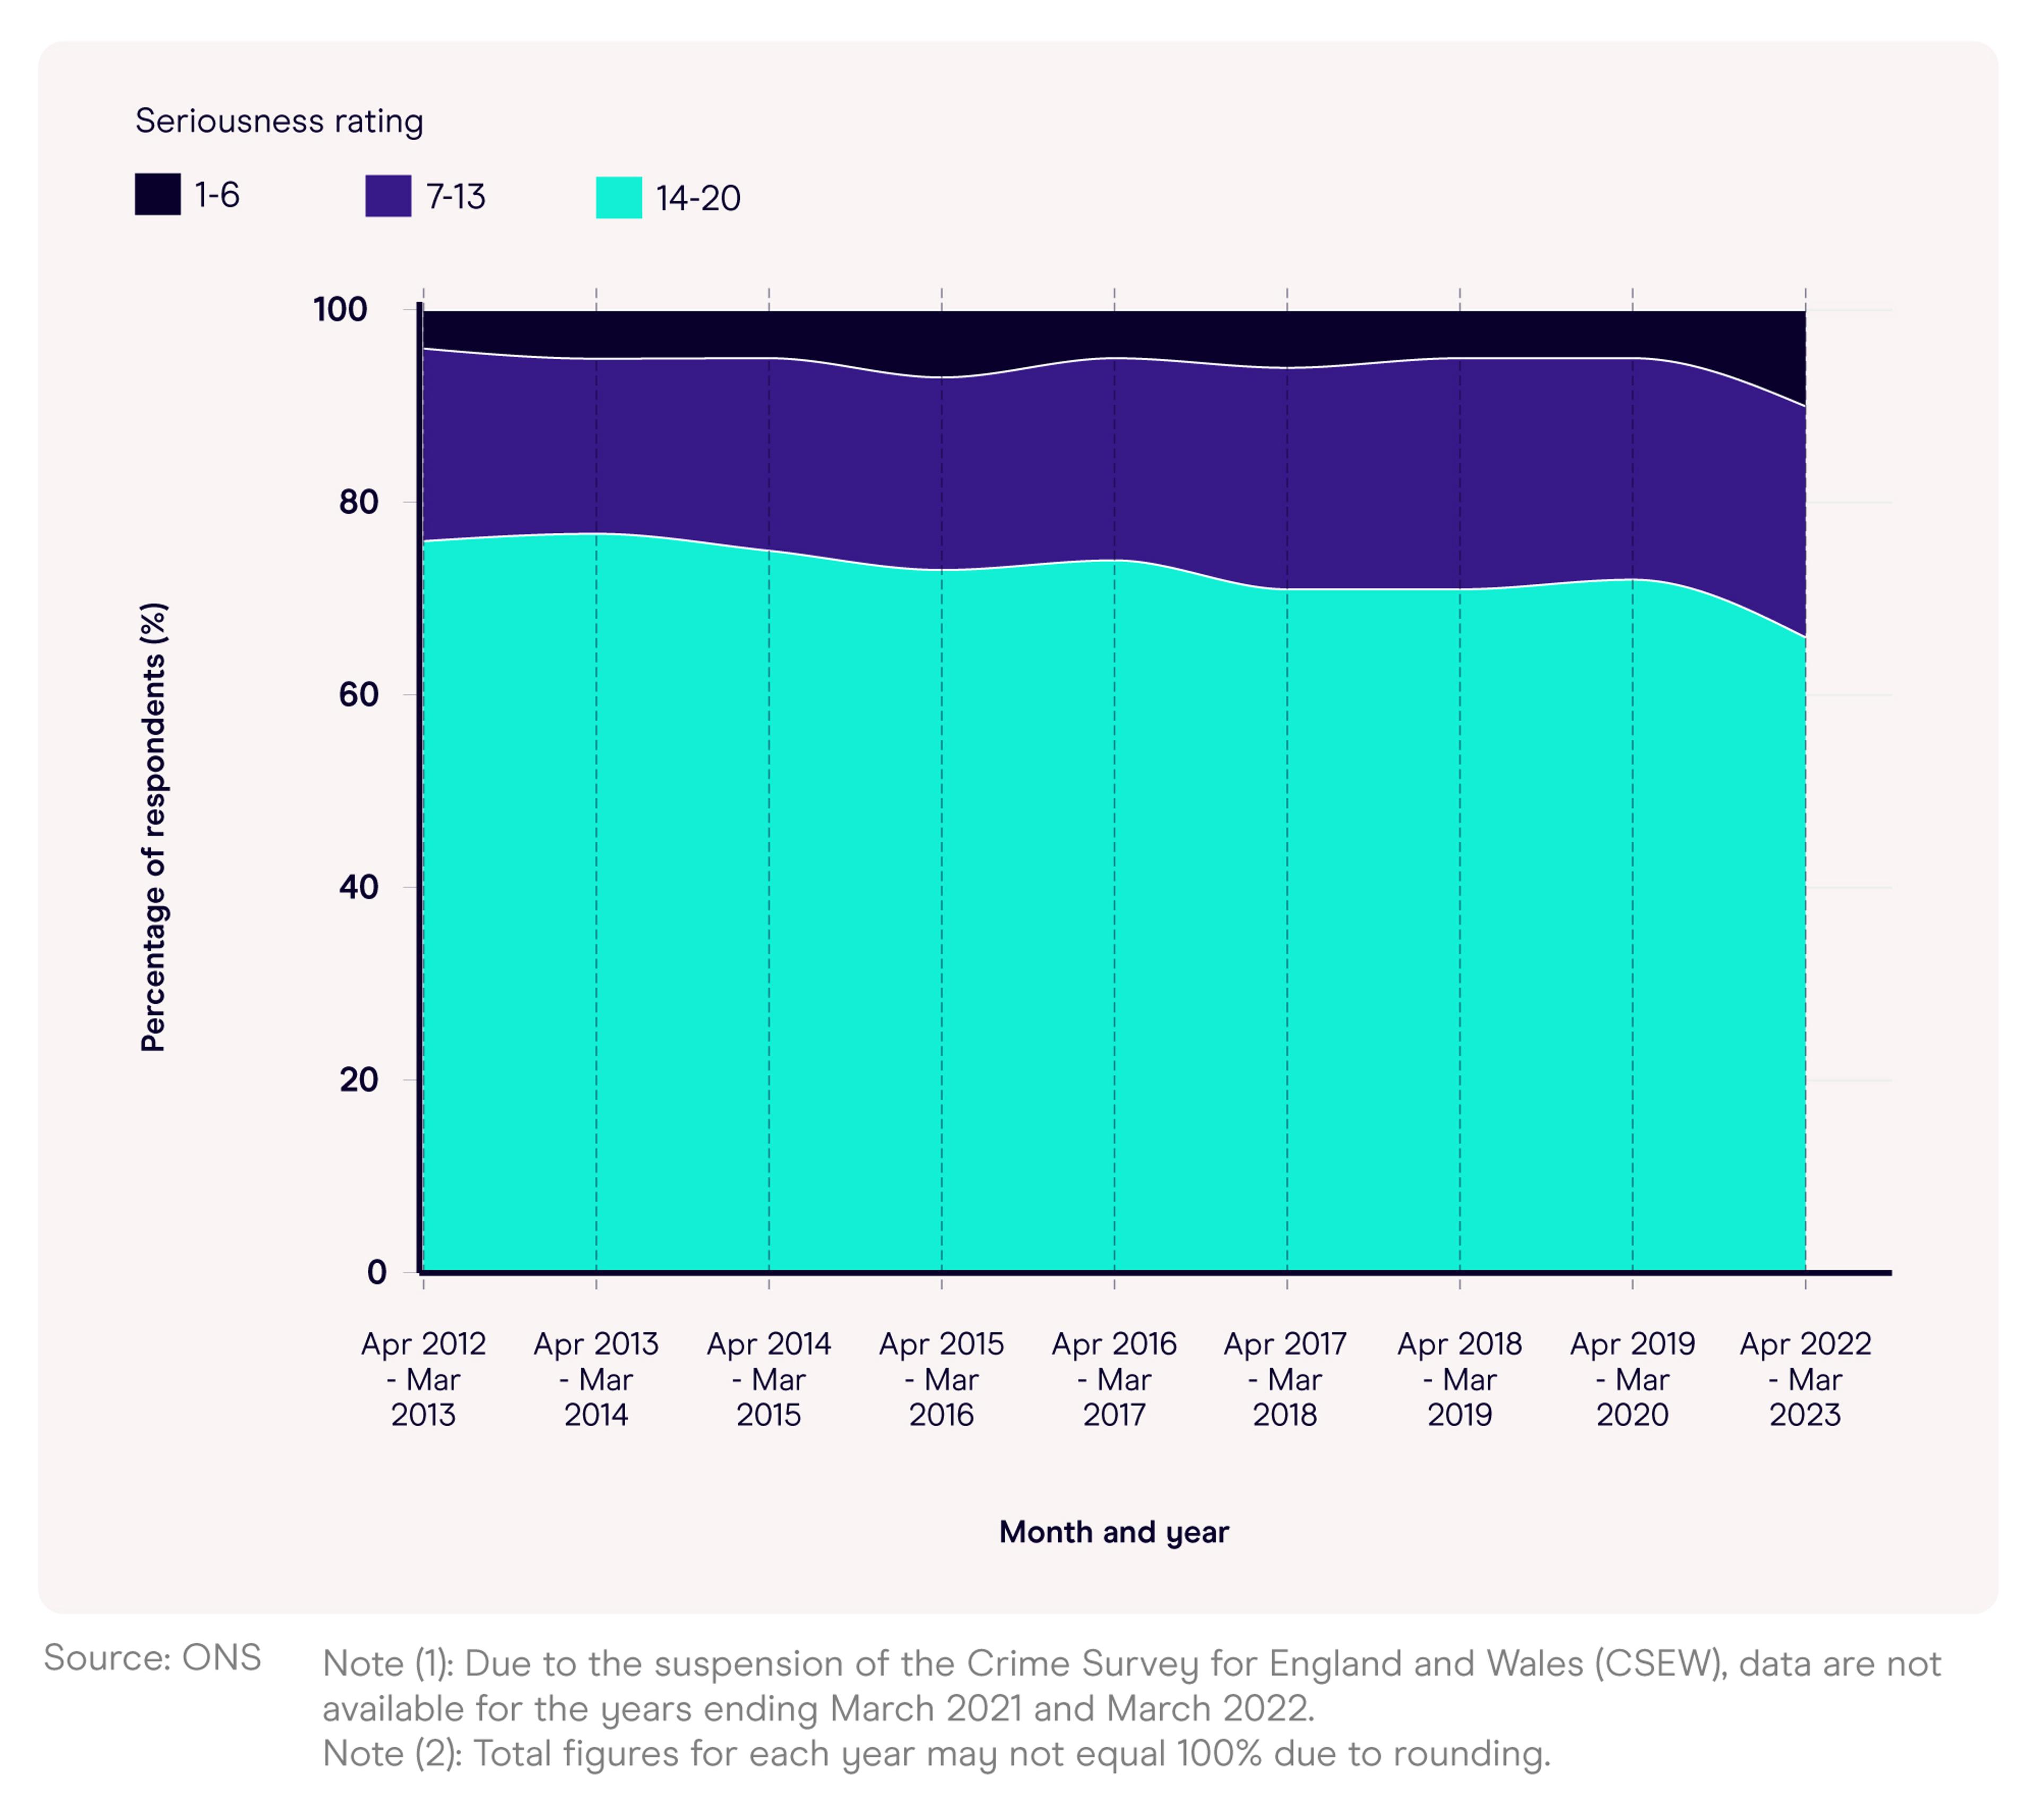
Note (1): Due to the suspension of the Crime Survey for England and Wales (CSEW), data are not available for the years ending March 2021 and March 2022.
Note (2): Total figures for each year may not equal 100% due to rounding.
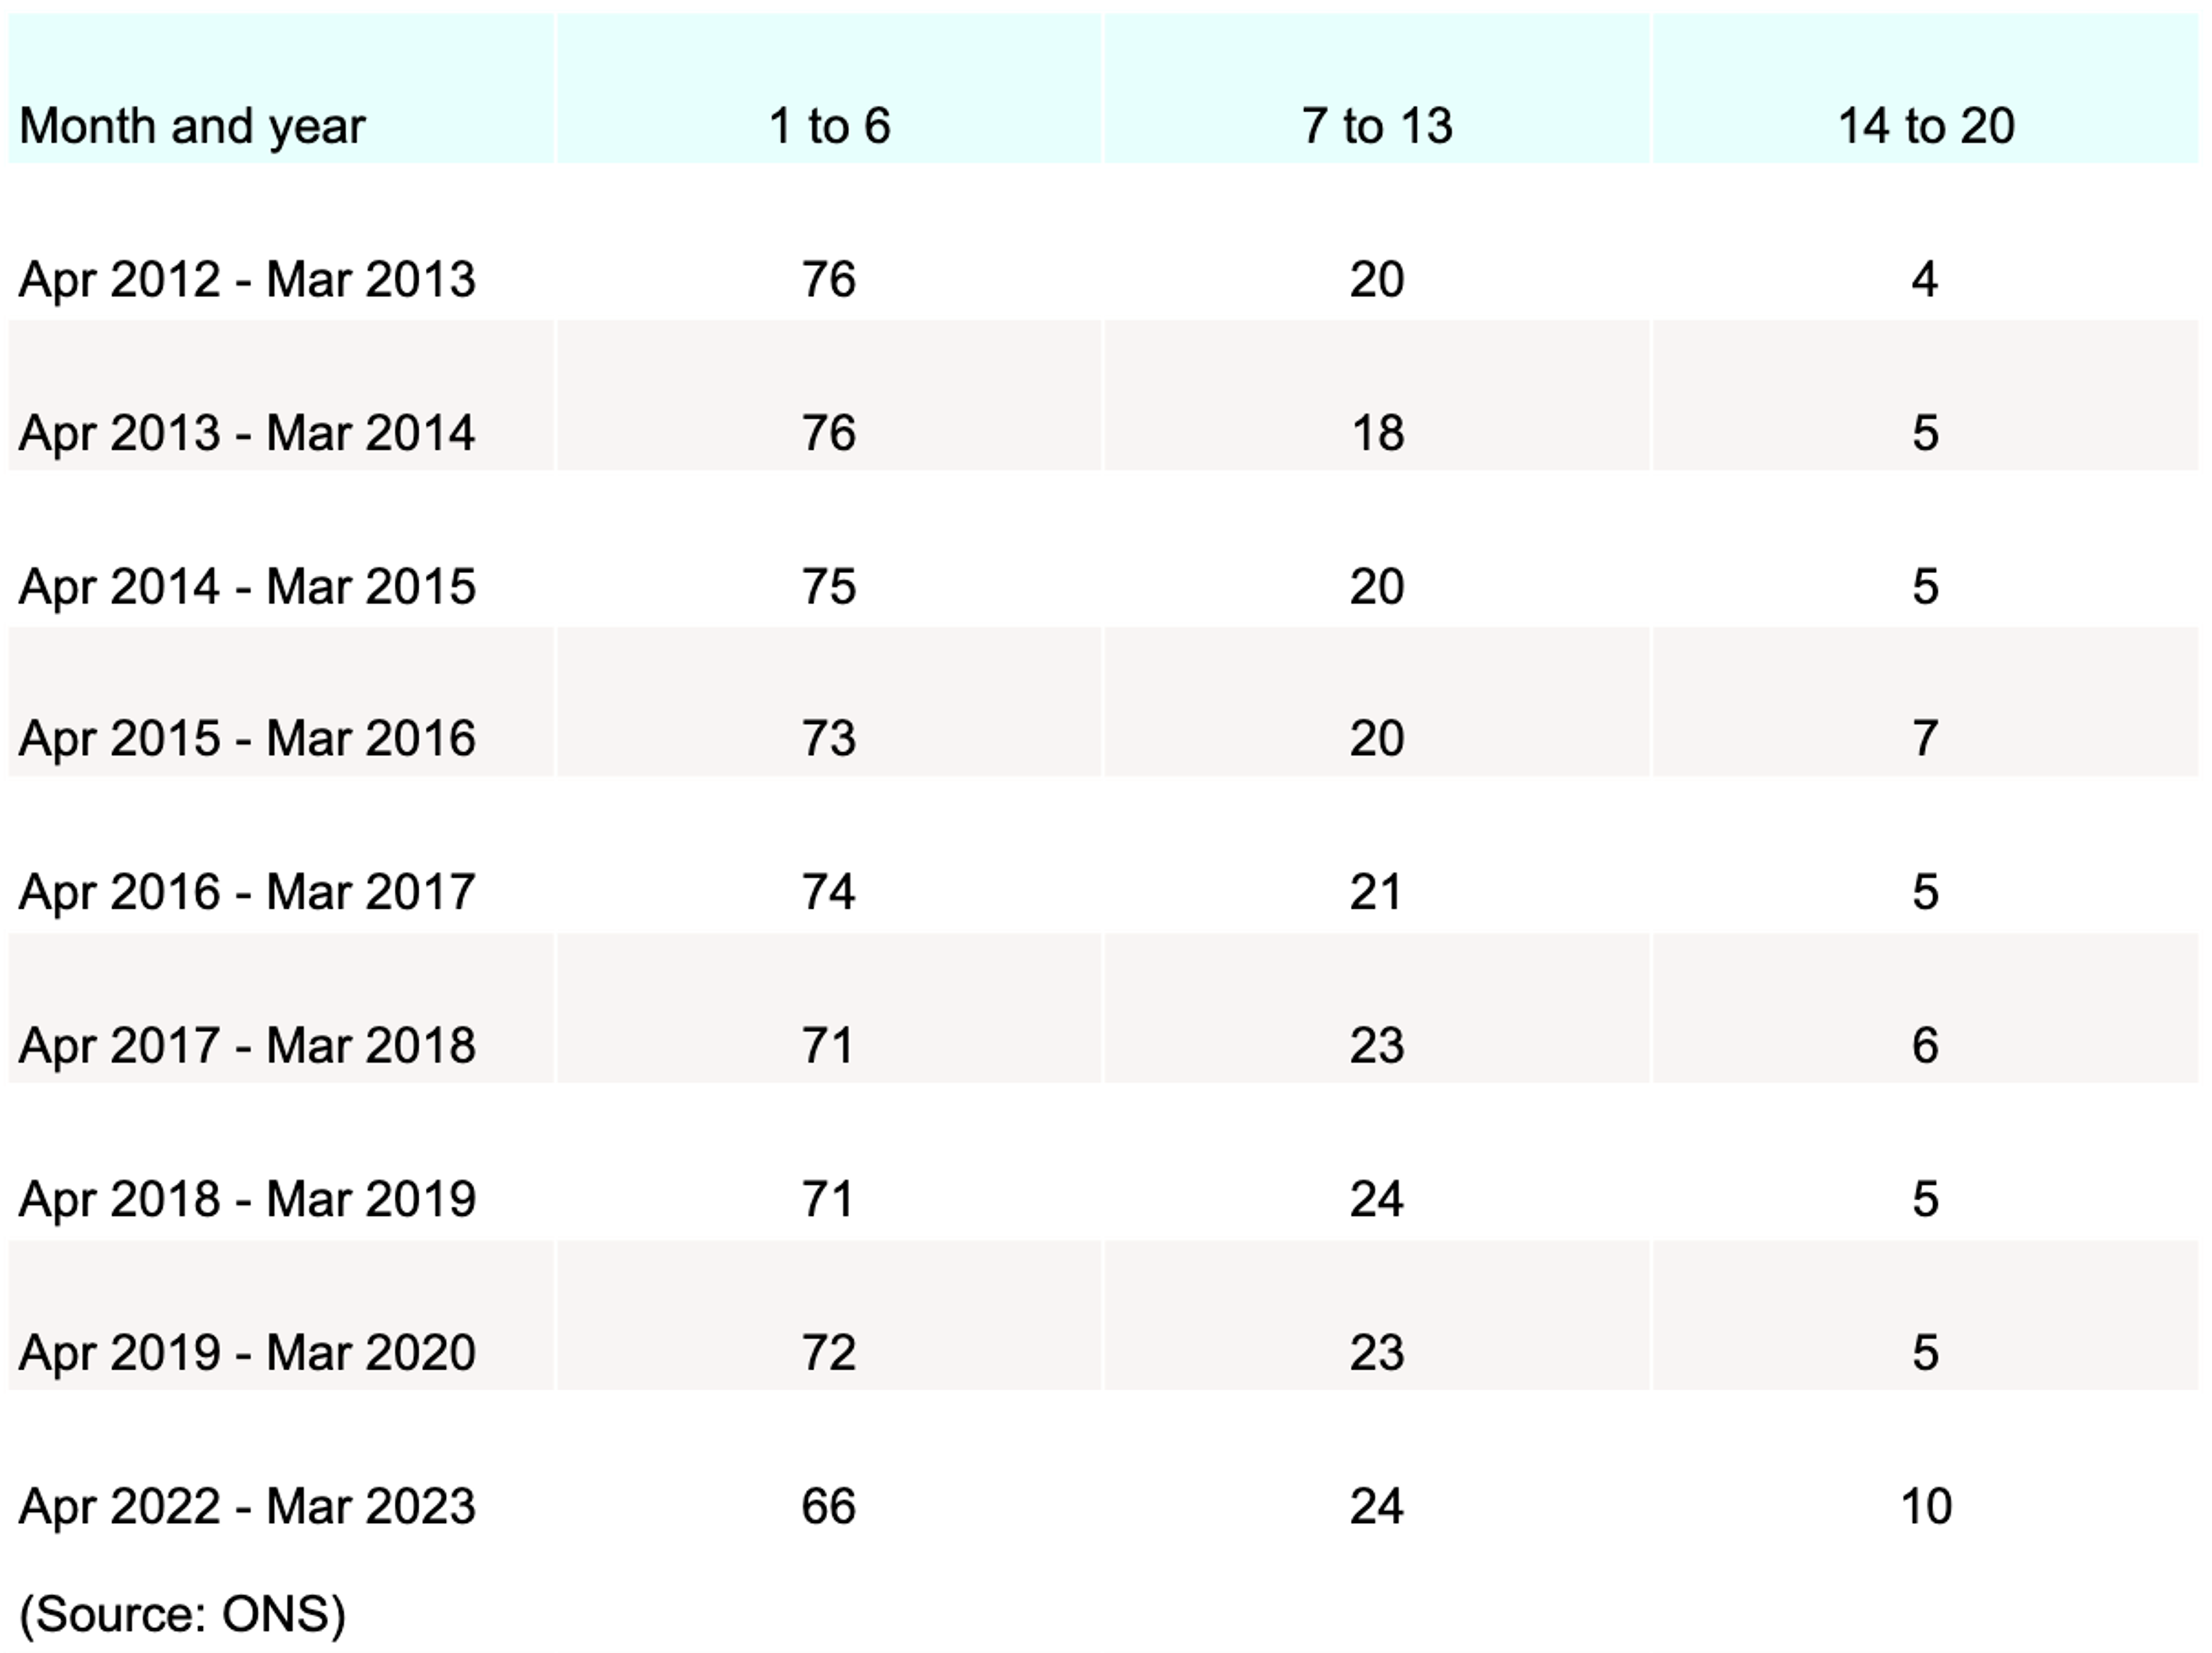
The ONS uses the Crime Severity Score (CSS) to measure the relative harm of different crimes in England and Wales. Weights are assigned based on sentencing data, with more serious offences typically receiving higher scores.
As of 2022-23, around two-thirds (66%) of vehicle thefts received a severity score of between 1-6, with just under a quarter (24%) falling into the next bracket (7-13). Incidentally, one in 10 (10%) car thefts from 2022-23 were graded with a seriousness score between 14-20 – a figure that has doubled compared to previous CSS outcomes.
This implies vehicle theft from 2022-23 was deemed to be more serious than in previous years and would help to explain the sudden drop in the proportion of vehicle crimes graded in the 1-5 category.
Between 2012-23, the percentage of vehicle thefts falling into this category dropped by 10 percentage points, suggesting sentencing is becoming stricter for perpetrators of vehicle theft.
Vehicle security statistics
Most common vehicle security precautions
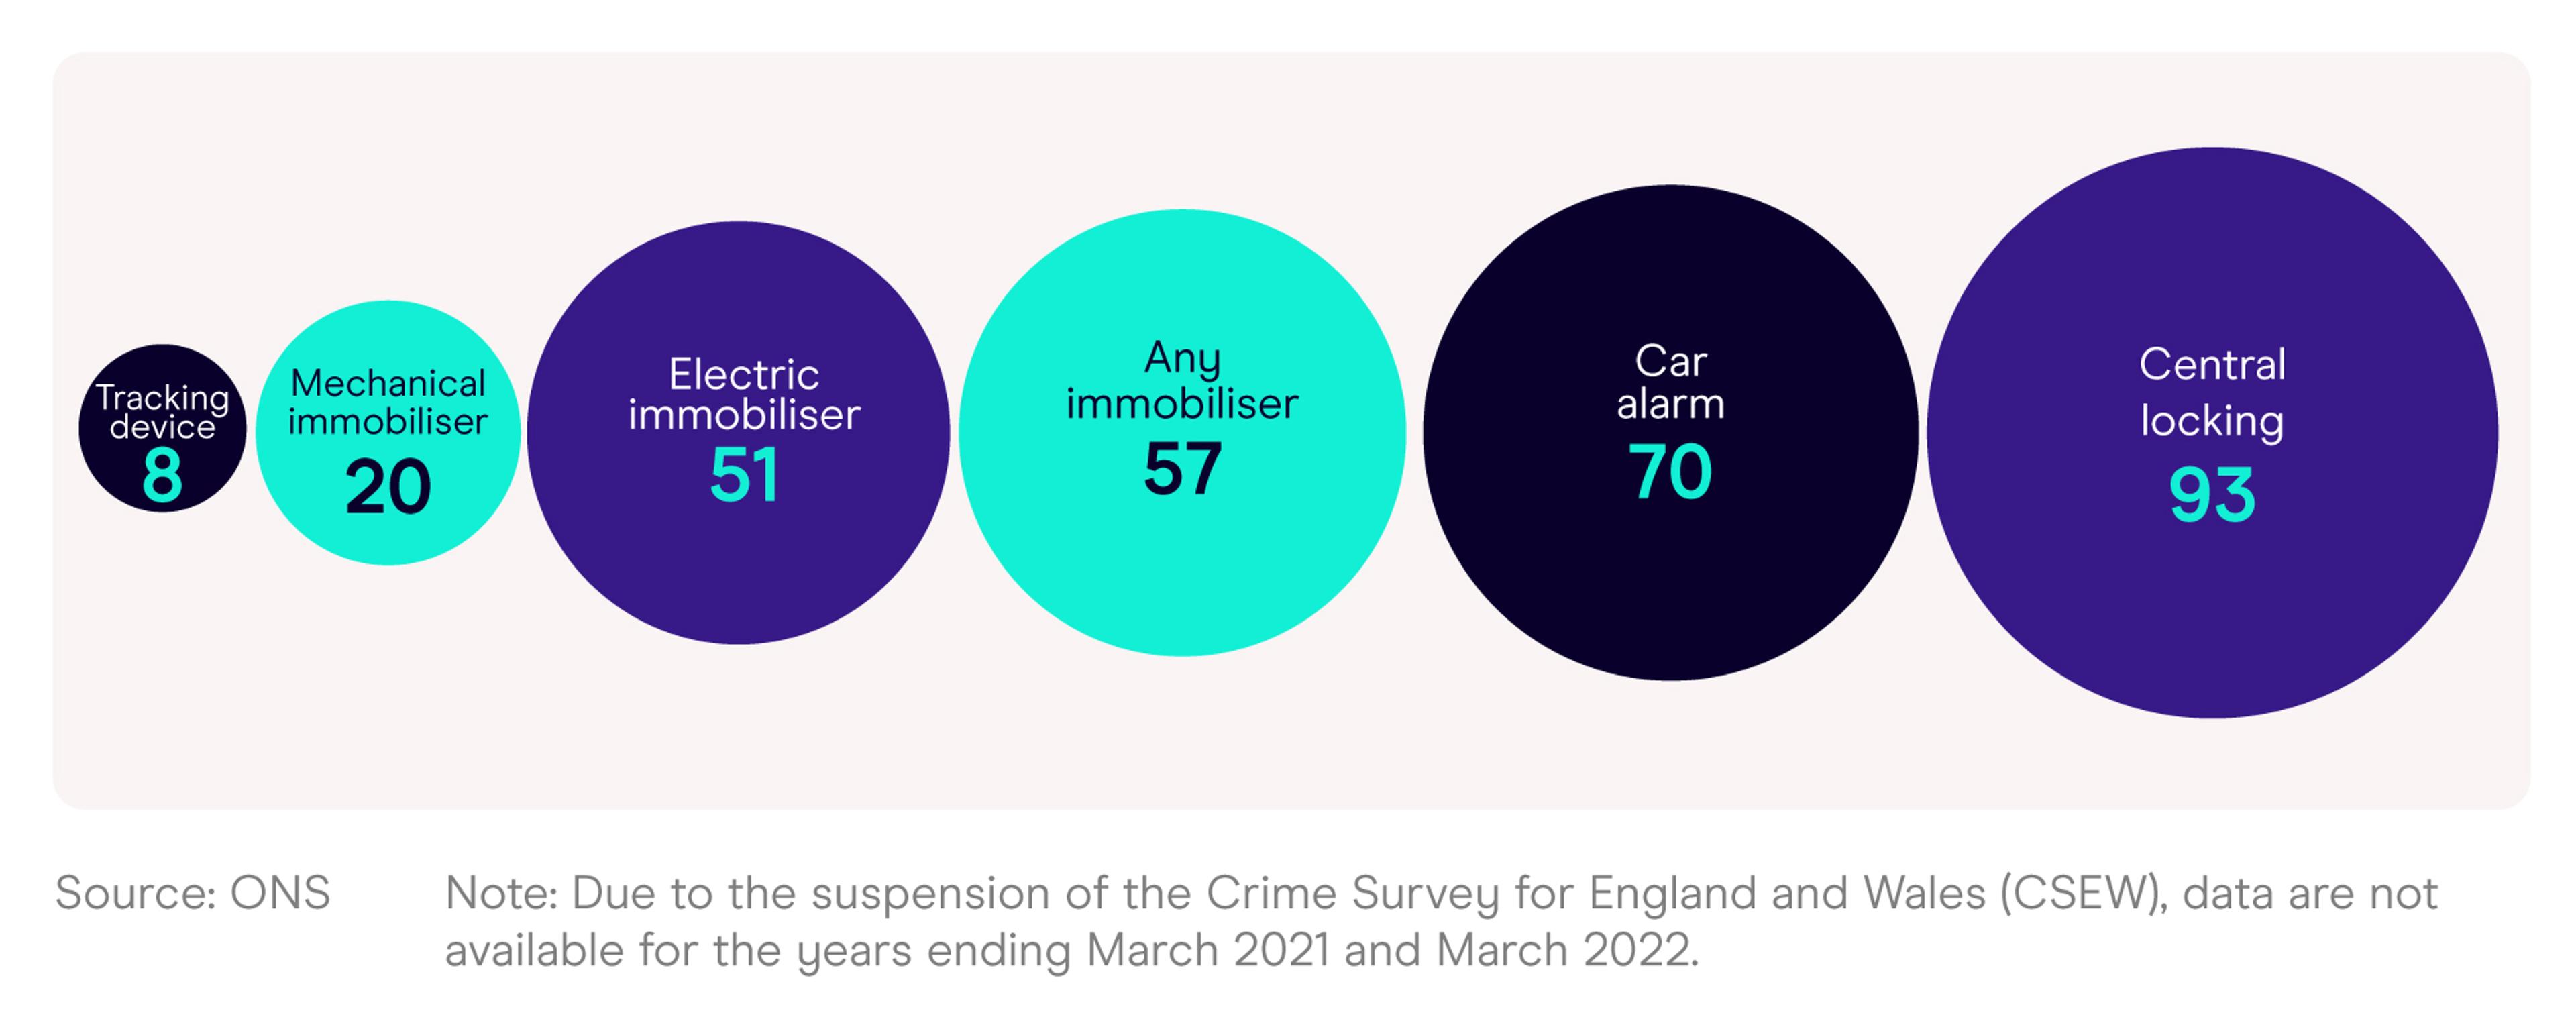
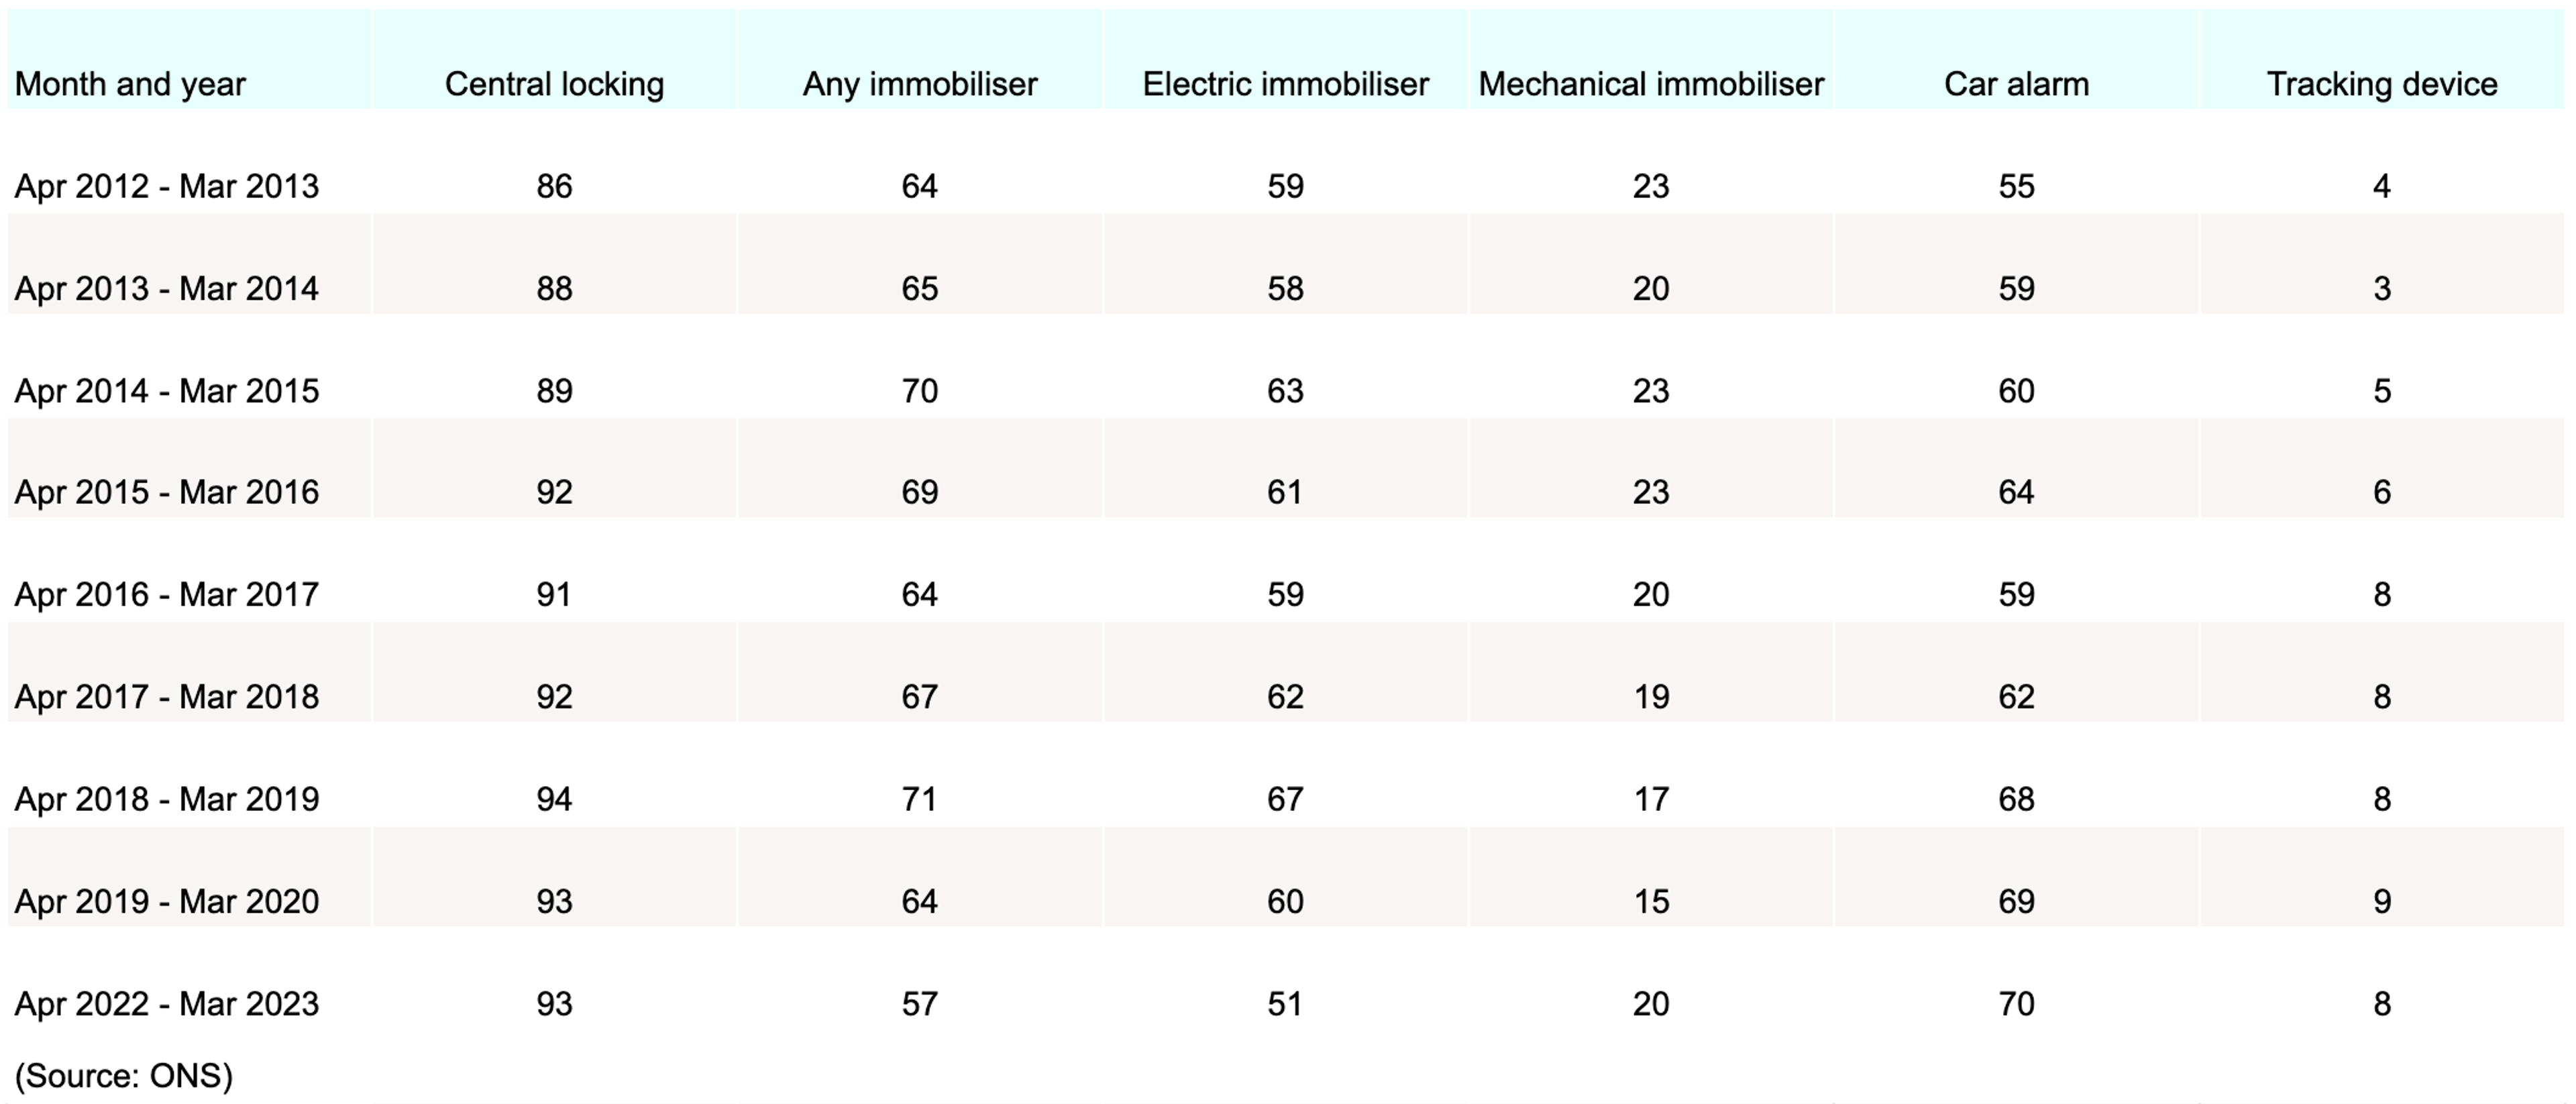
As of 2022-23, more than nine in 10 (93%) of those surveyed by the ONS had a central locking system in their vehicle, making this the most common vehicle security precaution taken by people in England and Wales – a trend that has prevailed over the previous decade.
Back in 2012-13, the respective figure stood at 86%, representing a seven-percentage-point increase in the space of 10 years.
The second most popular security feature on cars in 2022-23 was an alarm, possessed by around seven in 10 (70%) motorists. Back in 2012-13, just over half (55%) of people surveyed had this feature on their vehicles, indicating a 15 percentage point increase between 2012-23.
Note: Due to the suspension of the Crime Survey for England and Wales (CSEW), data are not available for the years ending March 2021 and March 2022.
From those questioned in 2022-23, just under three-fifths (57%) had an immobiliser on their vehicle. Despite making this the third most popular security measure for people’s vehicles, this was a 14-percentage-point decrease from the peak of 71% in 2018-19, suggesting other security measures are now becoming more popular.
Incidentally, although remaining the least popular security feature in vehicles for the previous 10 years, tracking devices have indeed doubled in popularity during this time, going from 4% in 2012-13 to 8% in 2022-23.
Car theft FAQs
View More UK Driving & Insurance Statistics
If you’re looking for deeper insights into UK driving behaviour, insurance trends and road safety, explore our full library of data-led statistics pages. Each guide includes detailed figures, expert commentary and actionable takeaways for drivers, tradespeople and delivery workers.
UK Driving Offence Statistics
Explore the latest UK driving offence statistics, including speeding, mobile phone offences, penalty points, age comparisons and regional hotspots.
Food Delivery Statistics
Dive into comprehensive food delivery statistics covering rider demographics, risk patterns, earnings and the growth of the UK delivery sector.
UK Van Driver Statistics
Learn more about the nation’s tradespeople through our detailed UK van driver statistics, including incident rates, mileage patterns and regional breakdowns.
Car Theft Statistics
Understand current UK trends, risk factors and the most-targeted models in our full car theft statistics guide.
Young Driver Statistics
Get insights into telematics behaviour, pass rates, claims data and insurance trends in our latest young driver statistics report.
Gender Car Insurance Statistics
Discover how premiums vary across age groups and regions in our detailed gender car insurance statistics breakdown.
UK Uber Driver Statistics
Explore key insights into earnings, hours worked, demographics, vehicle choices and safety trends in our comprehensive guide to UK Uber driver statistics.
Learn More About Zego’s Products and Services
Zego provides insurance designed for modern drivers — from private hire professionals to tradespeople, couriers, young drivers and those using cutting-edge vehicle technology. Explore our range of products below to learn more.
Private Hire Insurance
Cover built specifically for professional drivers using platforms like Uber, Bolt and local operators.
Learn more about private hire insurance.
Telematics Insurance
Get personalised pricing based on how you drive, powered by the Zego Sense app.
Discover our telematics car insurance.
Courier Van Insurance
Insurance designed for van-based couriers carrying parcels or goods, perfect for Amazon and logistics work.
Explore courier van insurance.
Business Van Insurance
Annual, fully comprehensive cover for tradespeople and small businesses using vans for their own tools, materials and equipment.
Find out more about business van insurance.
Autonomous Vehicle Insights
Explore insurance implications, risks and opportunities as autonomous technology evolves.
Read more in our guide to autonomous vehicles.