Driving Offence Statistics UK
2025

In 2025, the picture is revealing: speeding remains the number one offence, drink driving still hasn’t gone away, and dangerous driving is climbing at an alarming pace.
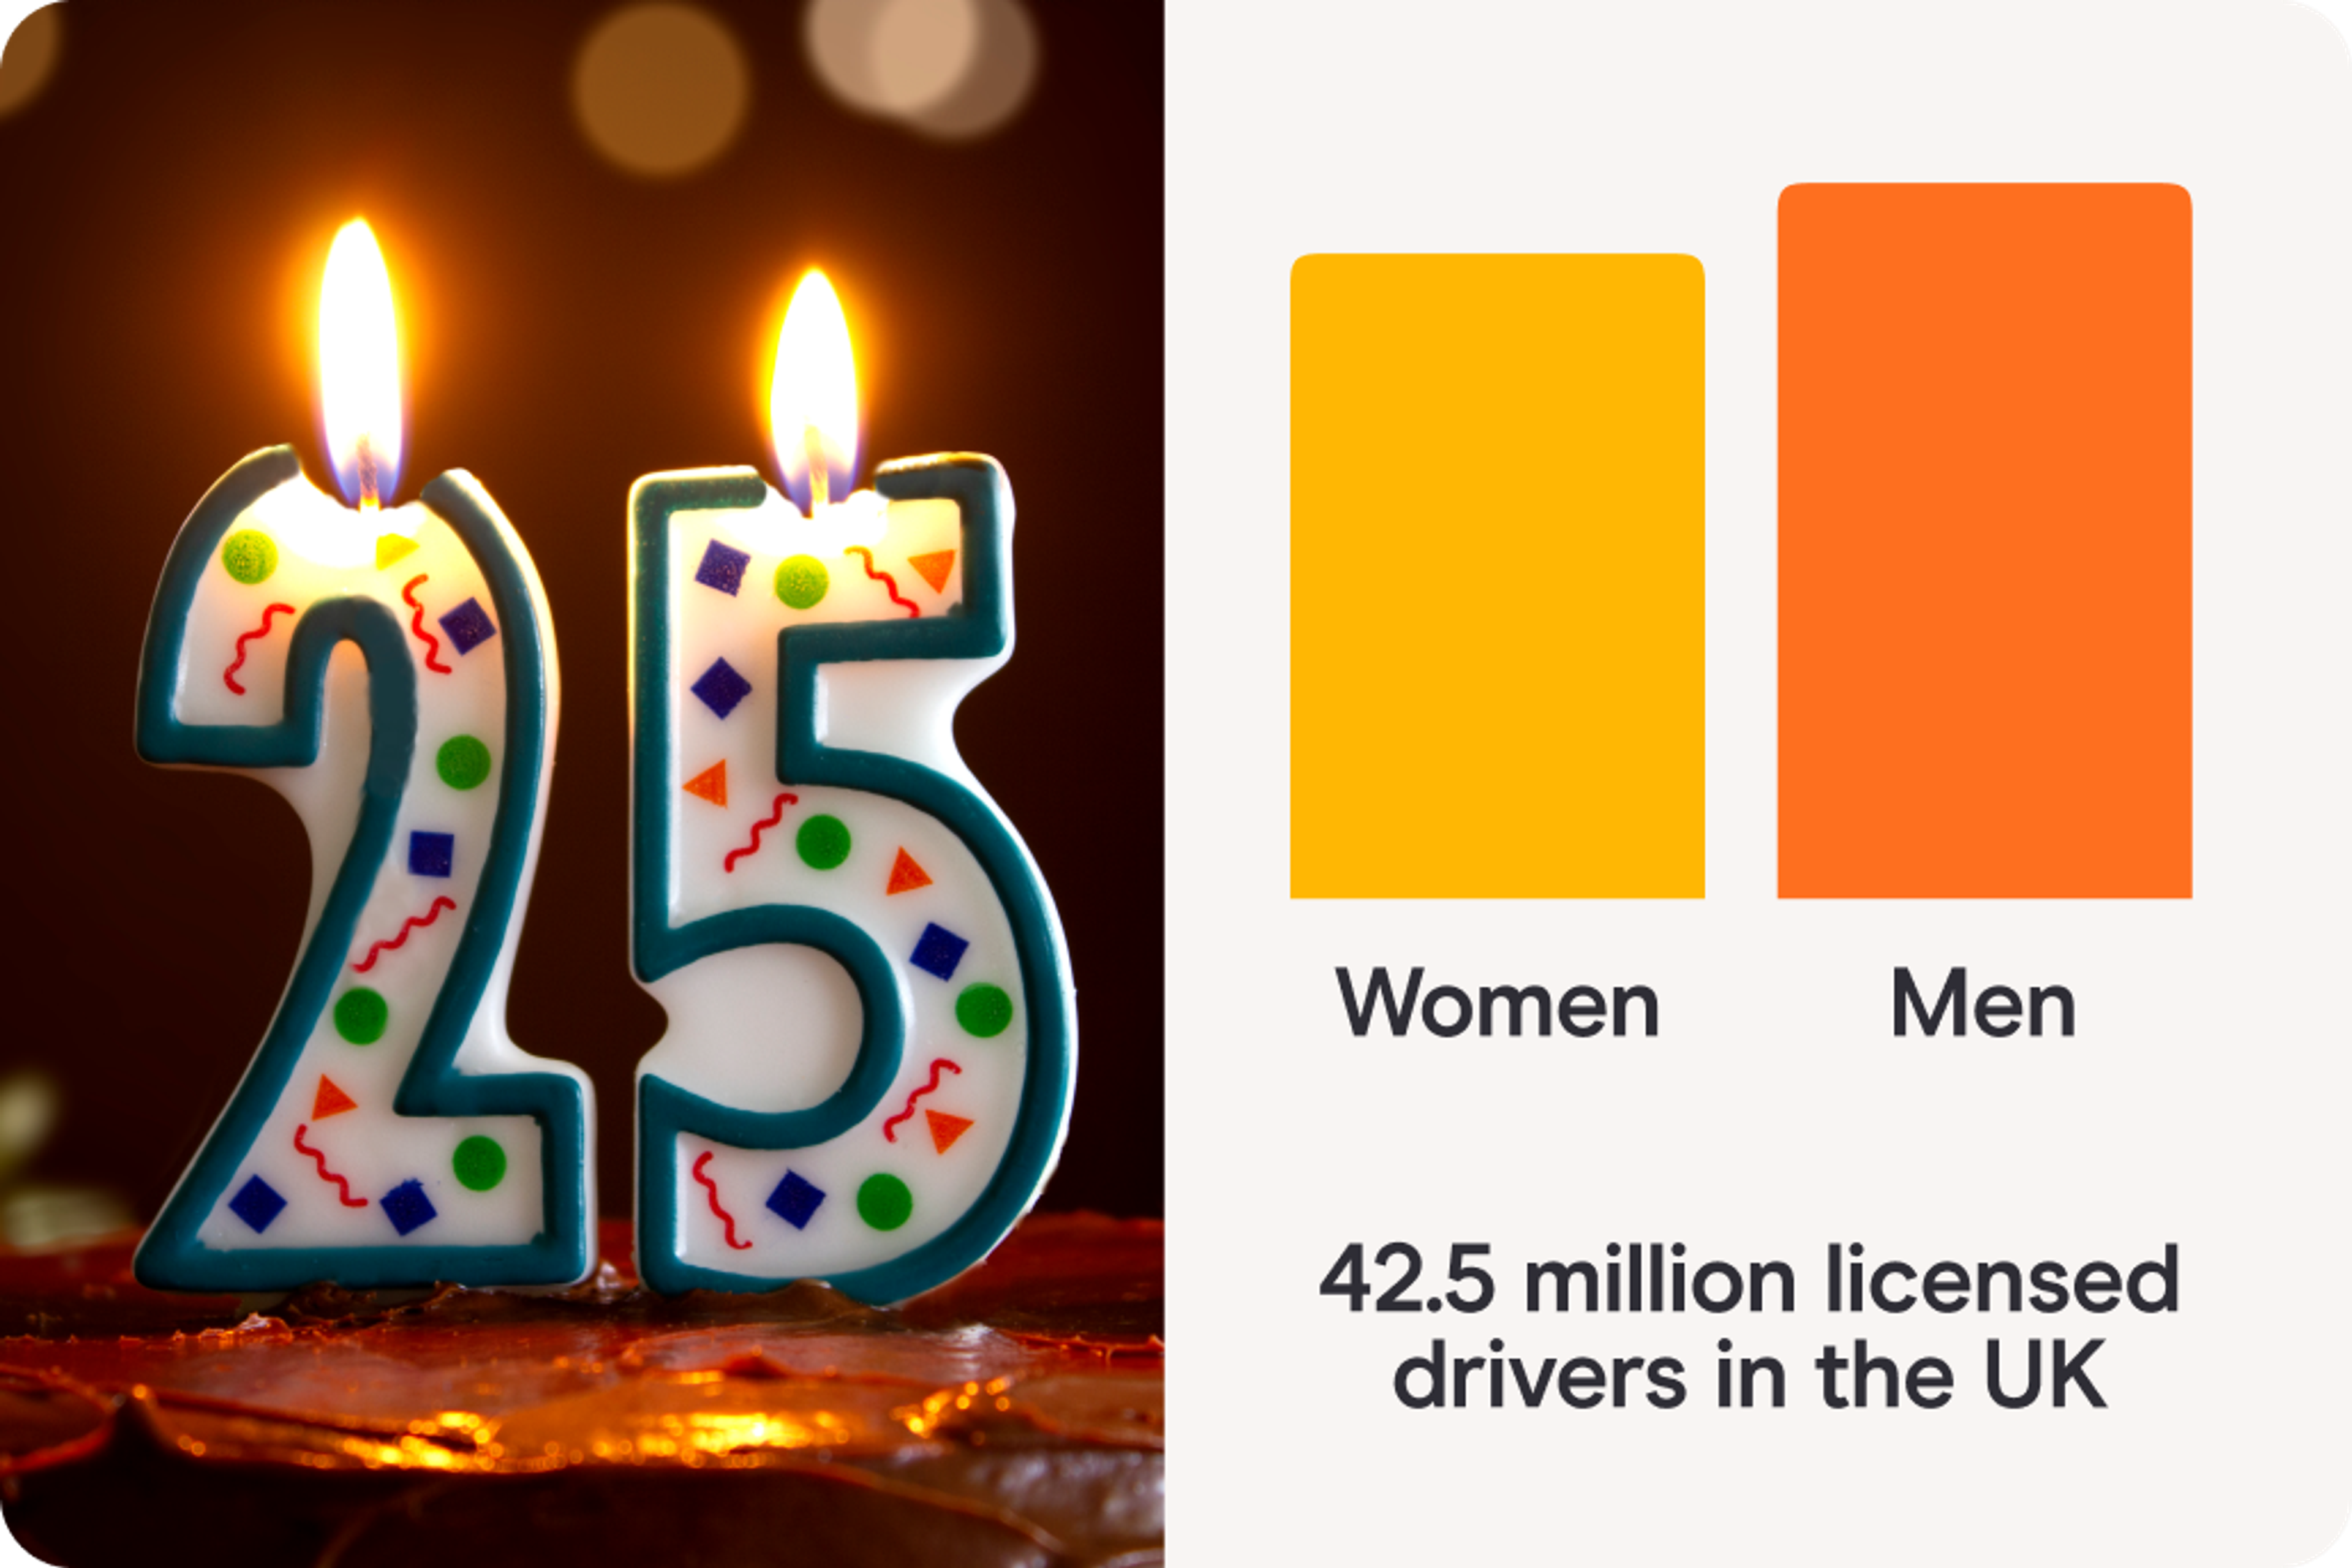
Who’s really behind the wheel of offences?
This pattern lines up with what we’ve already seen in our gender car insurance statistics, where men consistently face higher premiums due to riskier driving behaviours.
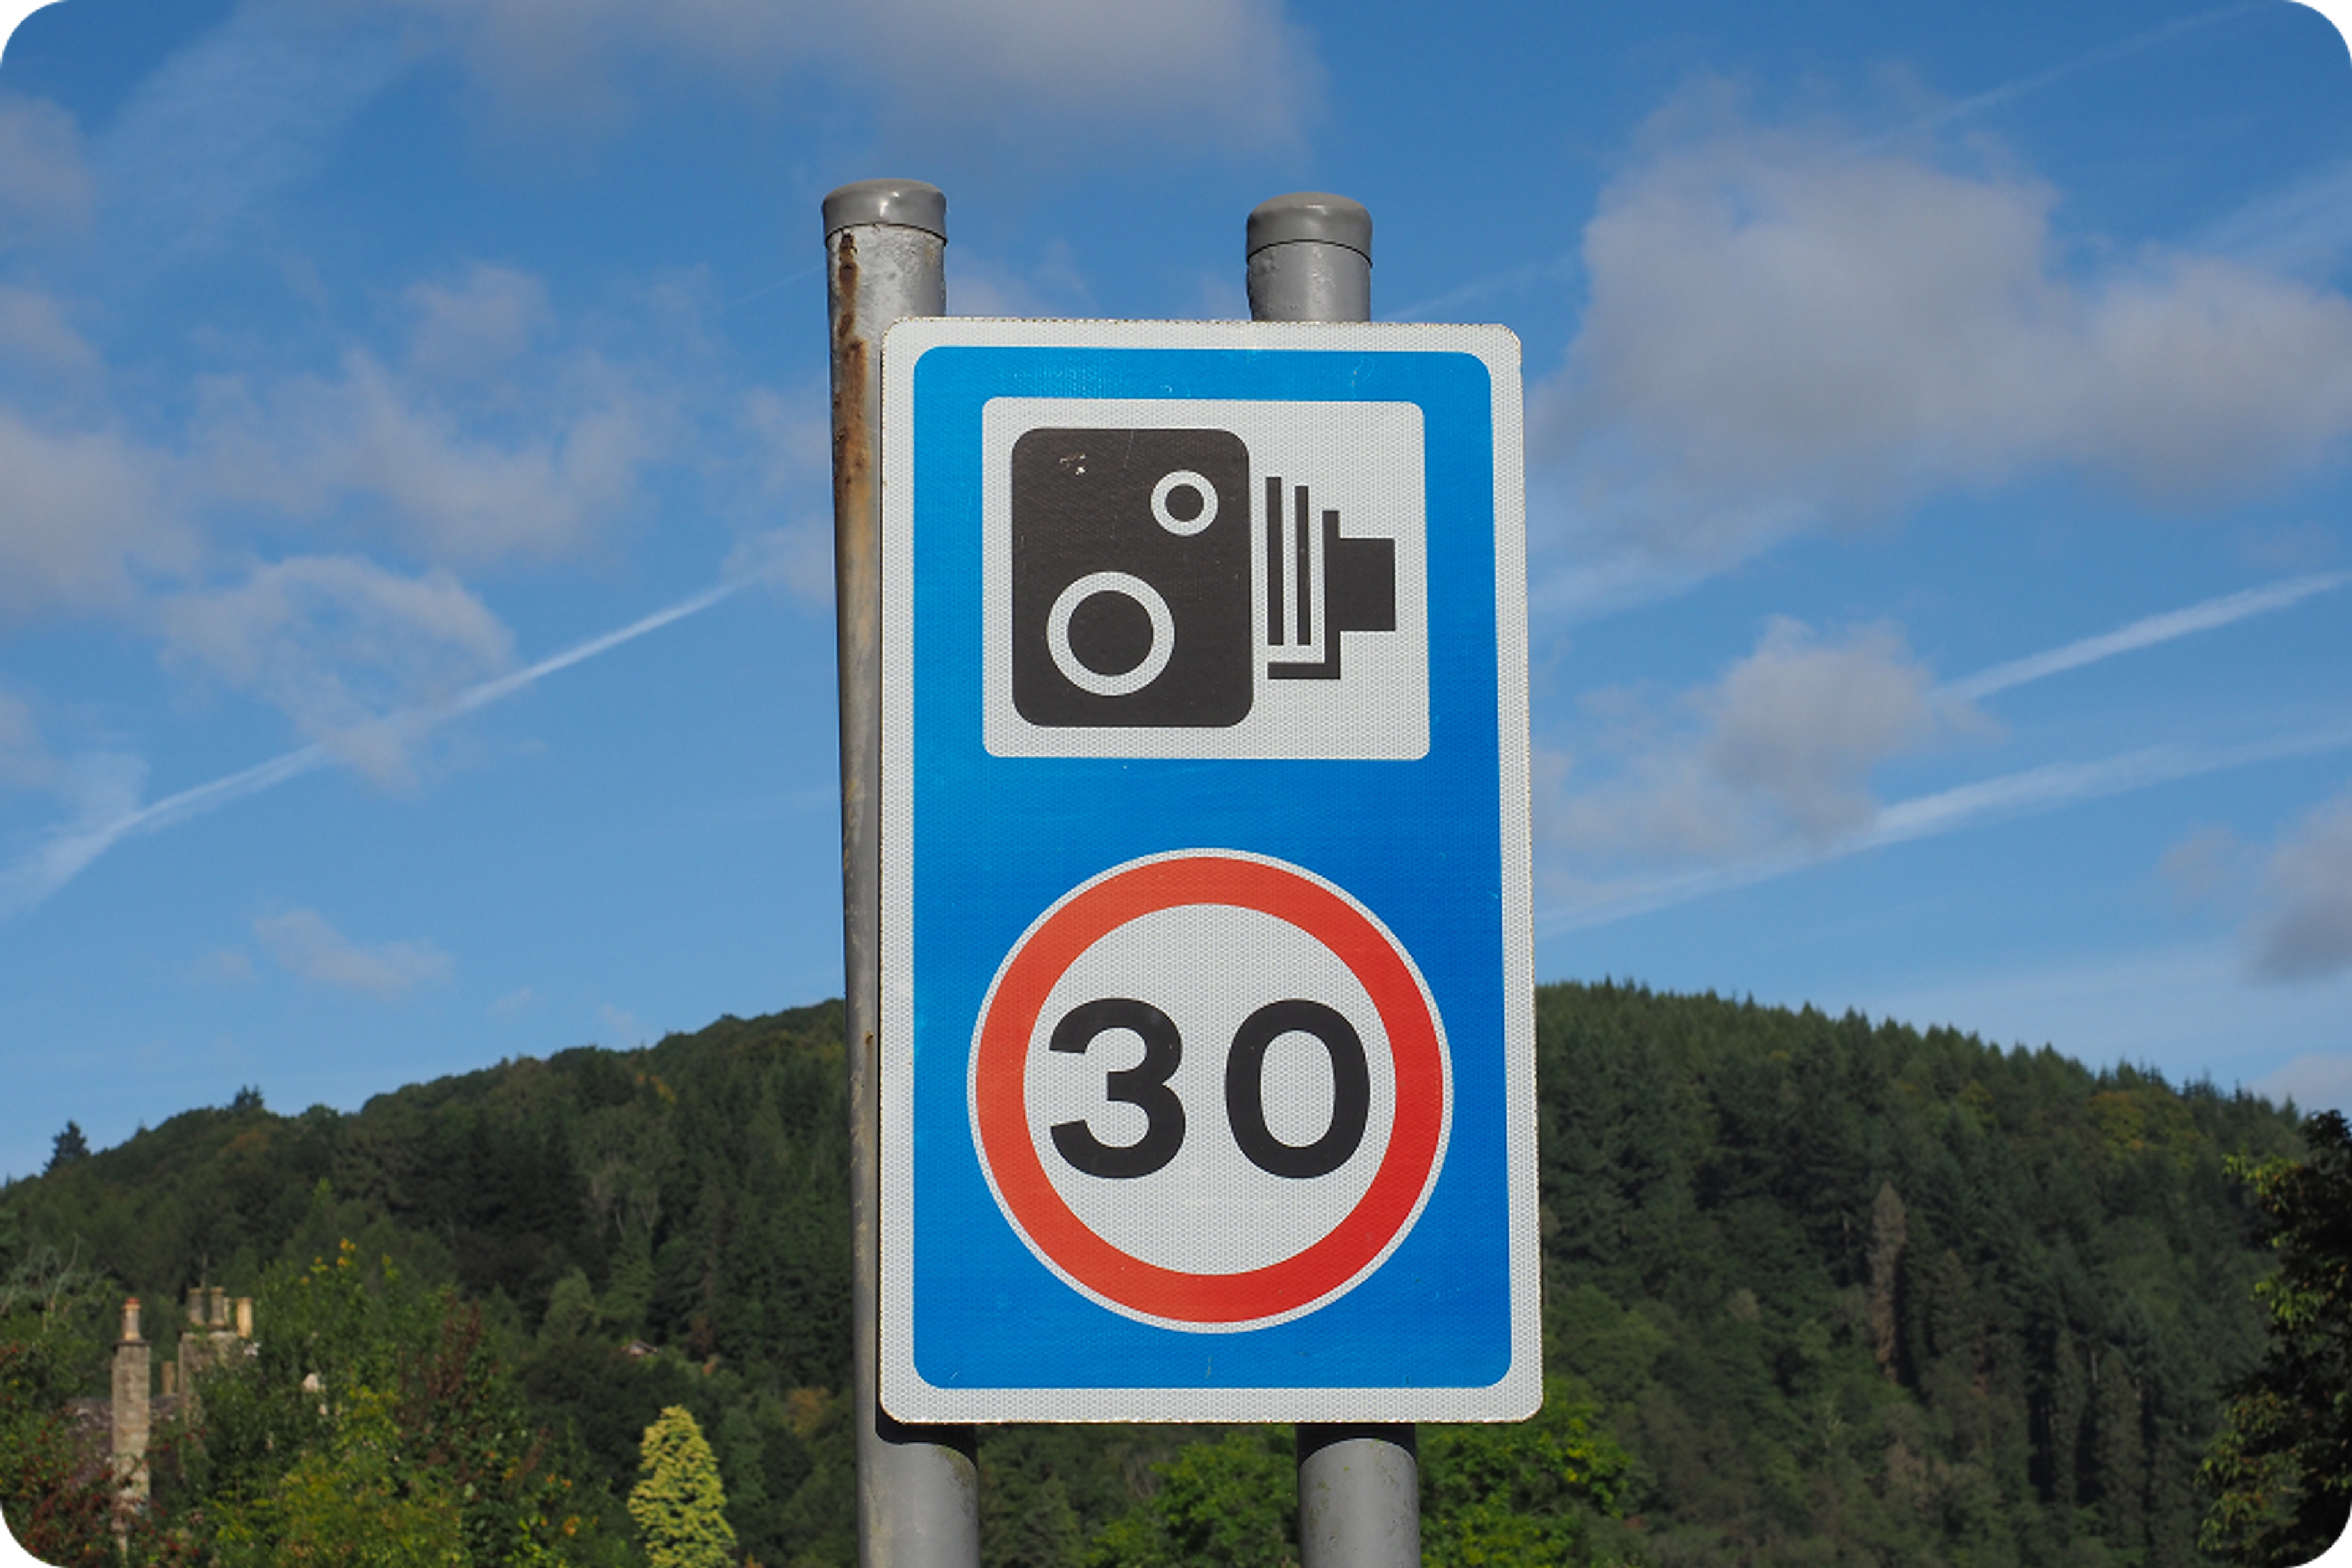
Speeding: still the biggest offence
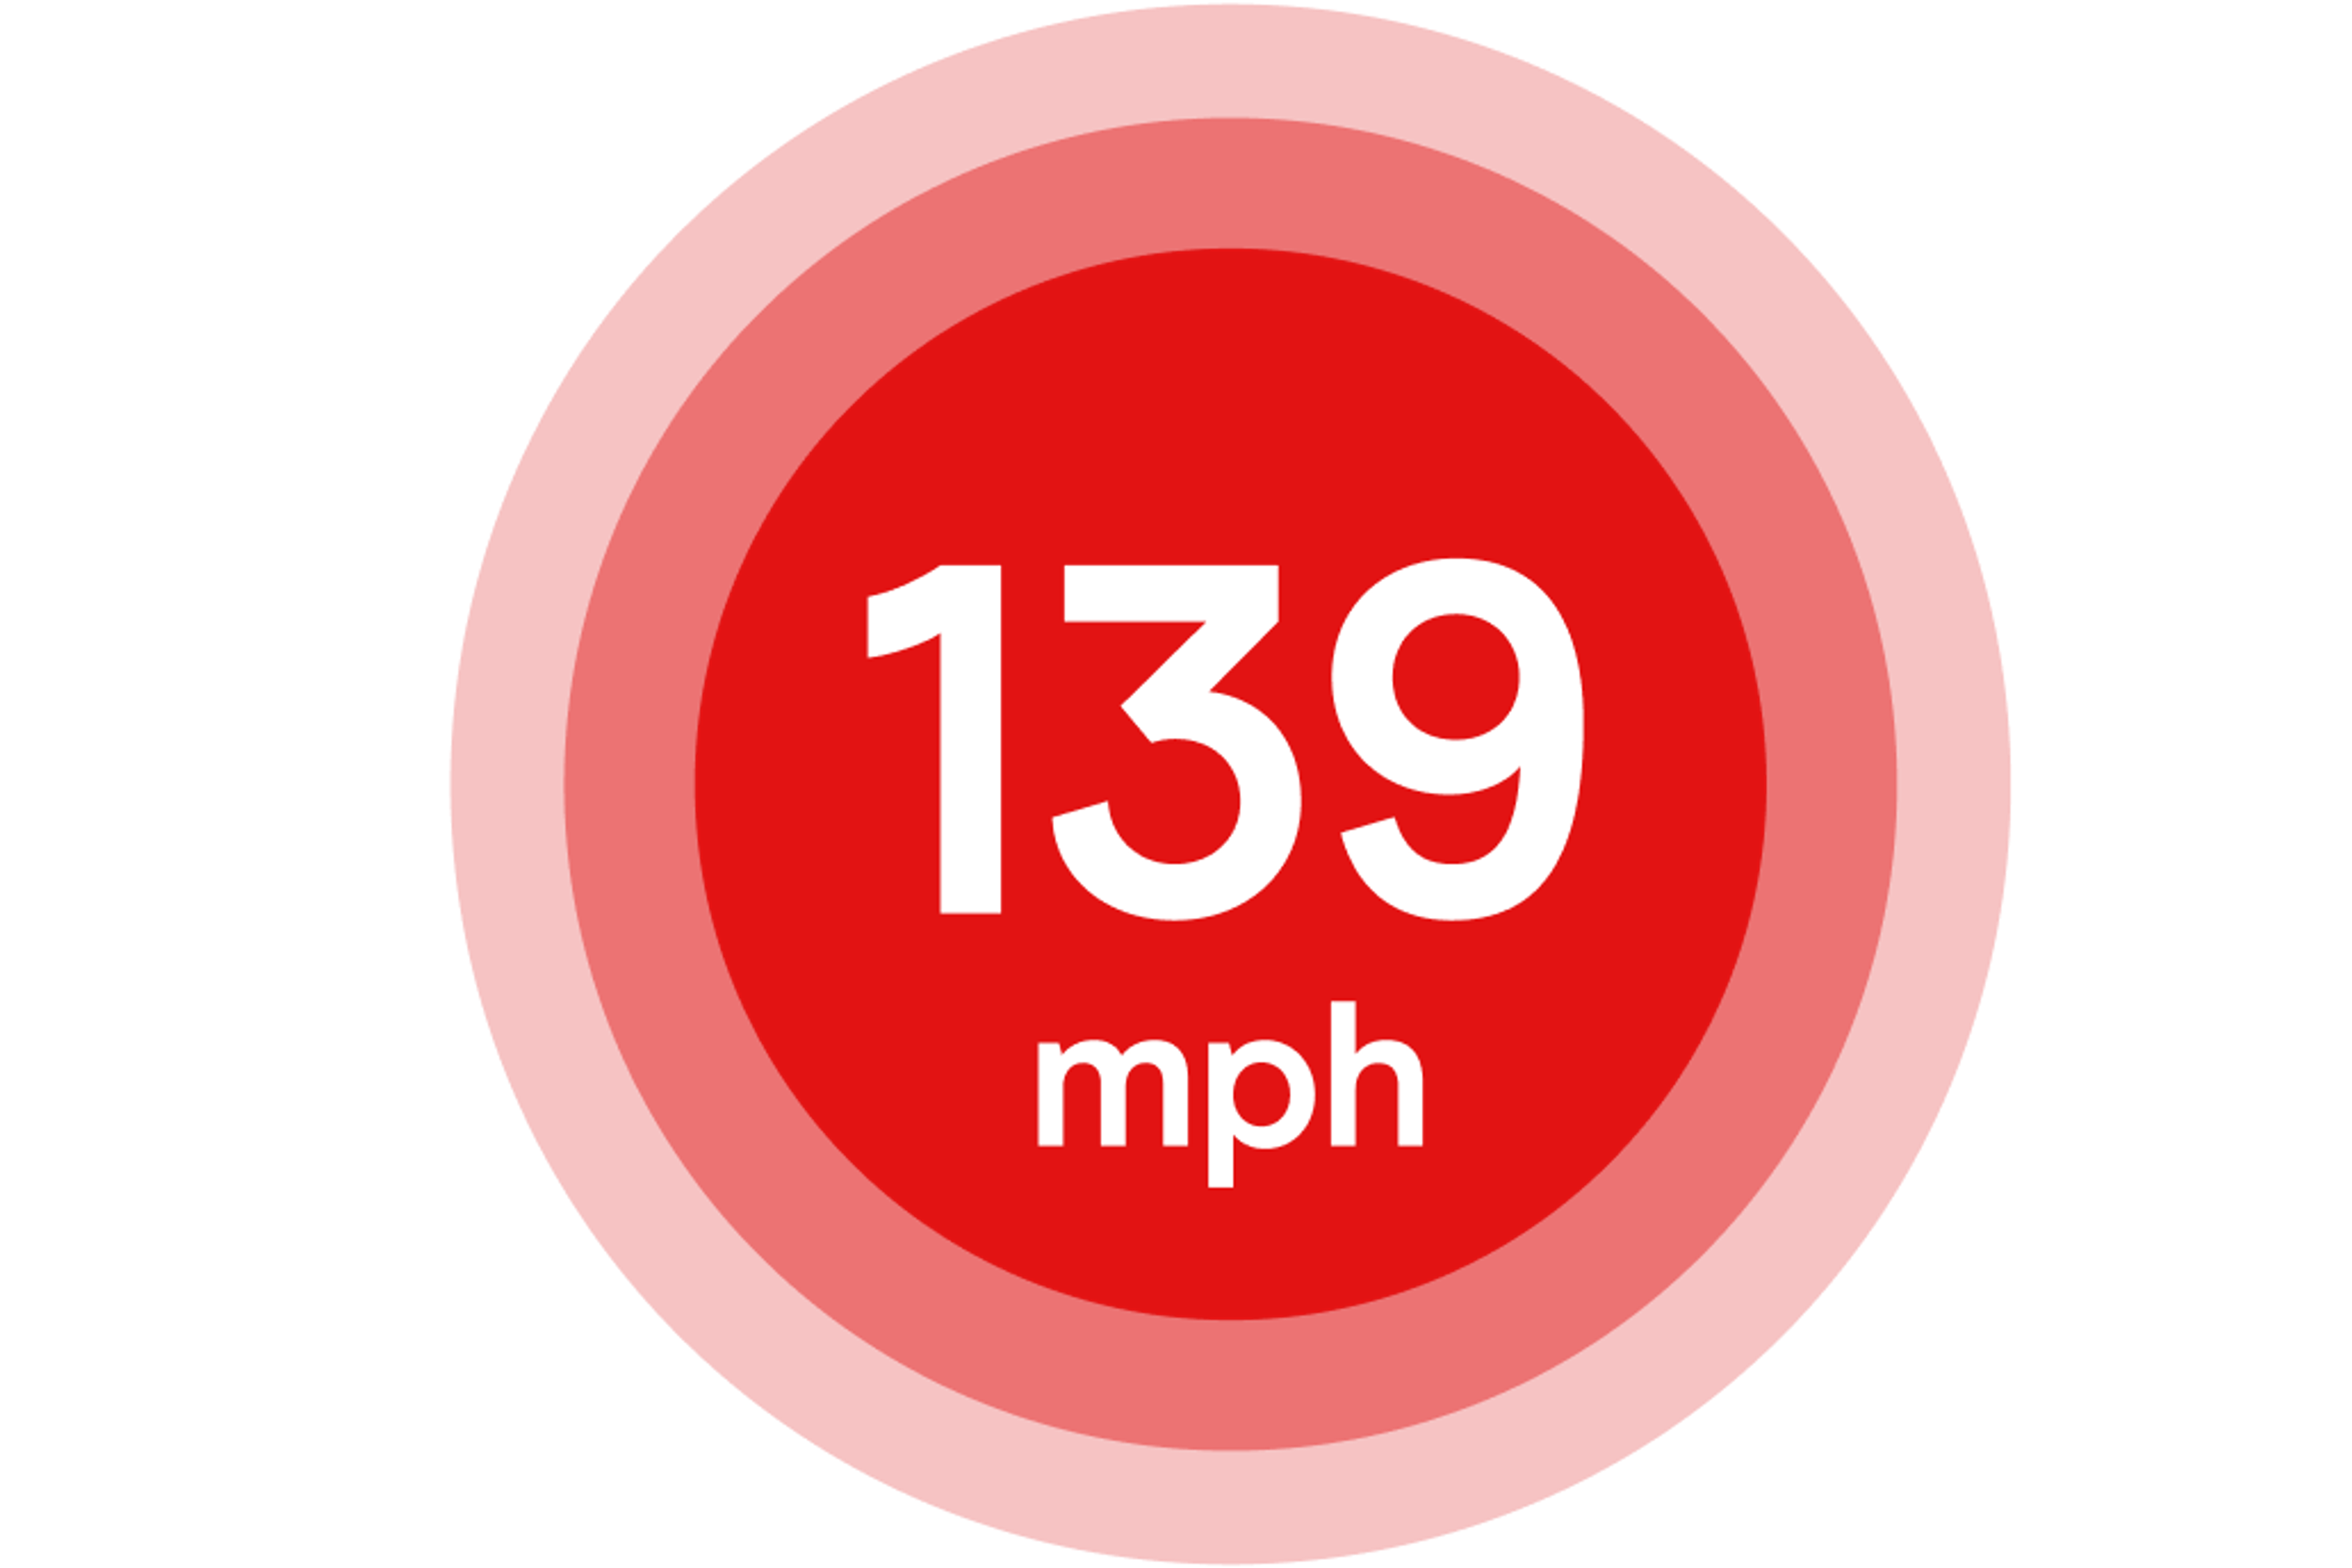
Some cases go way beyond creeping over the limit. In the last five years, more than 24,000 drivers have been caught doing over 100mph, including one recorded at 139mph on a 60mph road [5].
London stands out in particular. Speed limit offences soared to nearly 387,000 in 2023, a rise of 319% since 2018, largely caught on 20mph and 30mph roads [3].

Drink driving: the long-running problem
Men make up the majority of those convicted [11], reflecting a persistent risk pattern. For insurers, these offences carry a long tail, with higher premiums lasting years after the conviction.
For more on how this risk translates into higher costs for younger drivers, see our young driver insurance statistics.
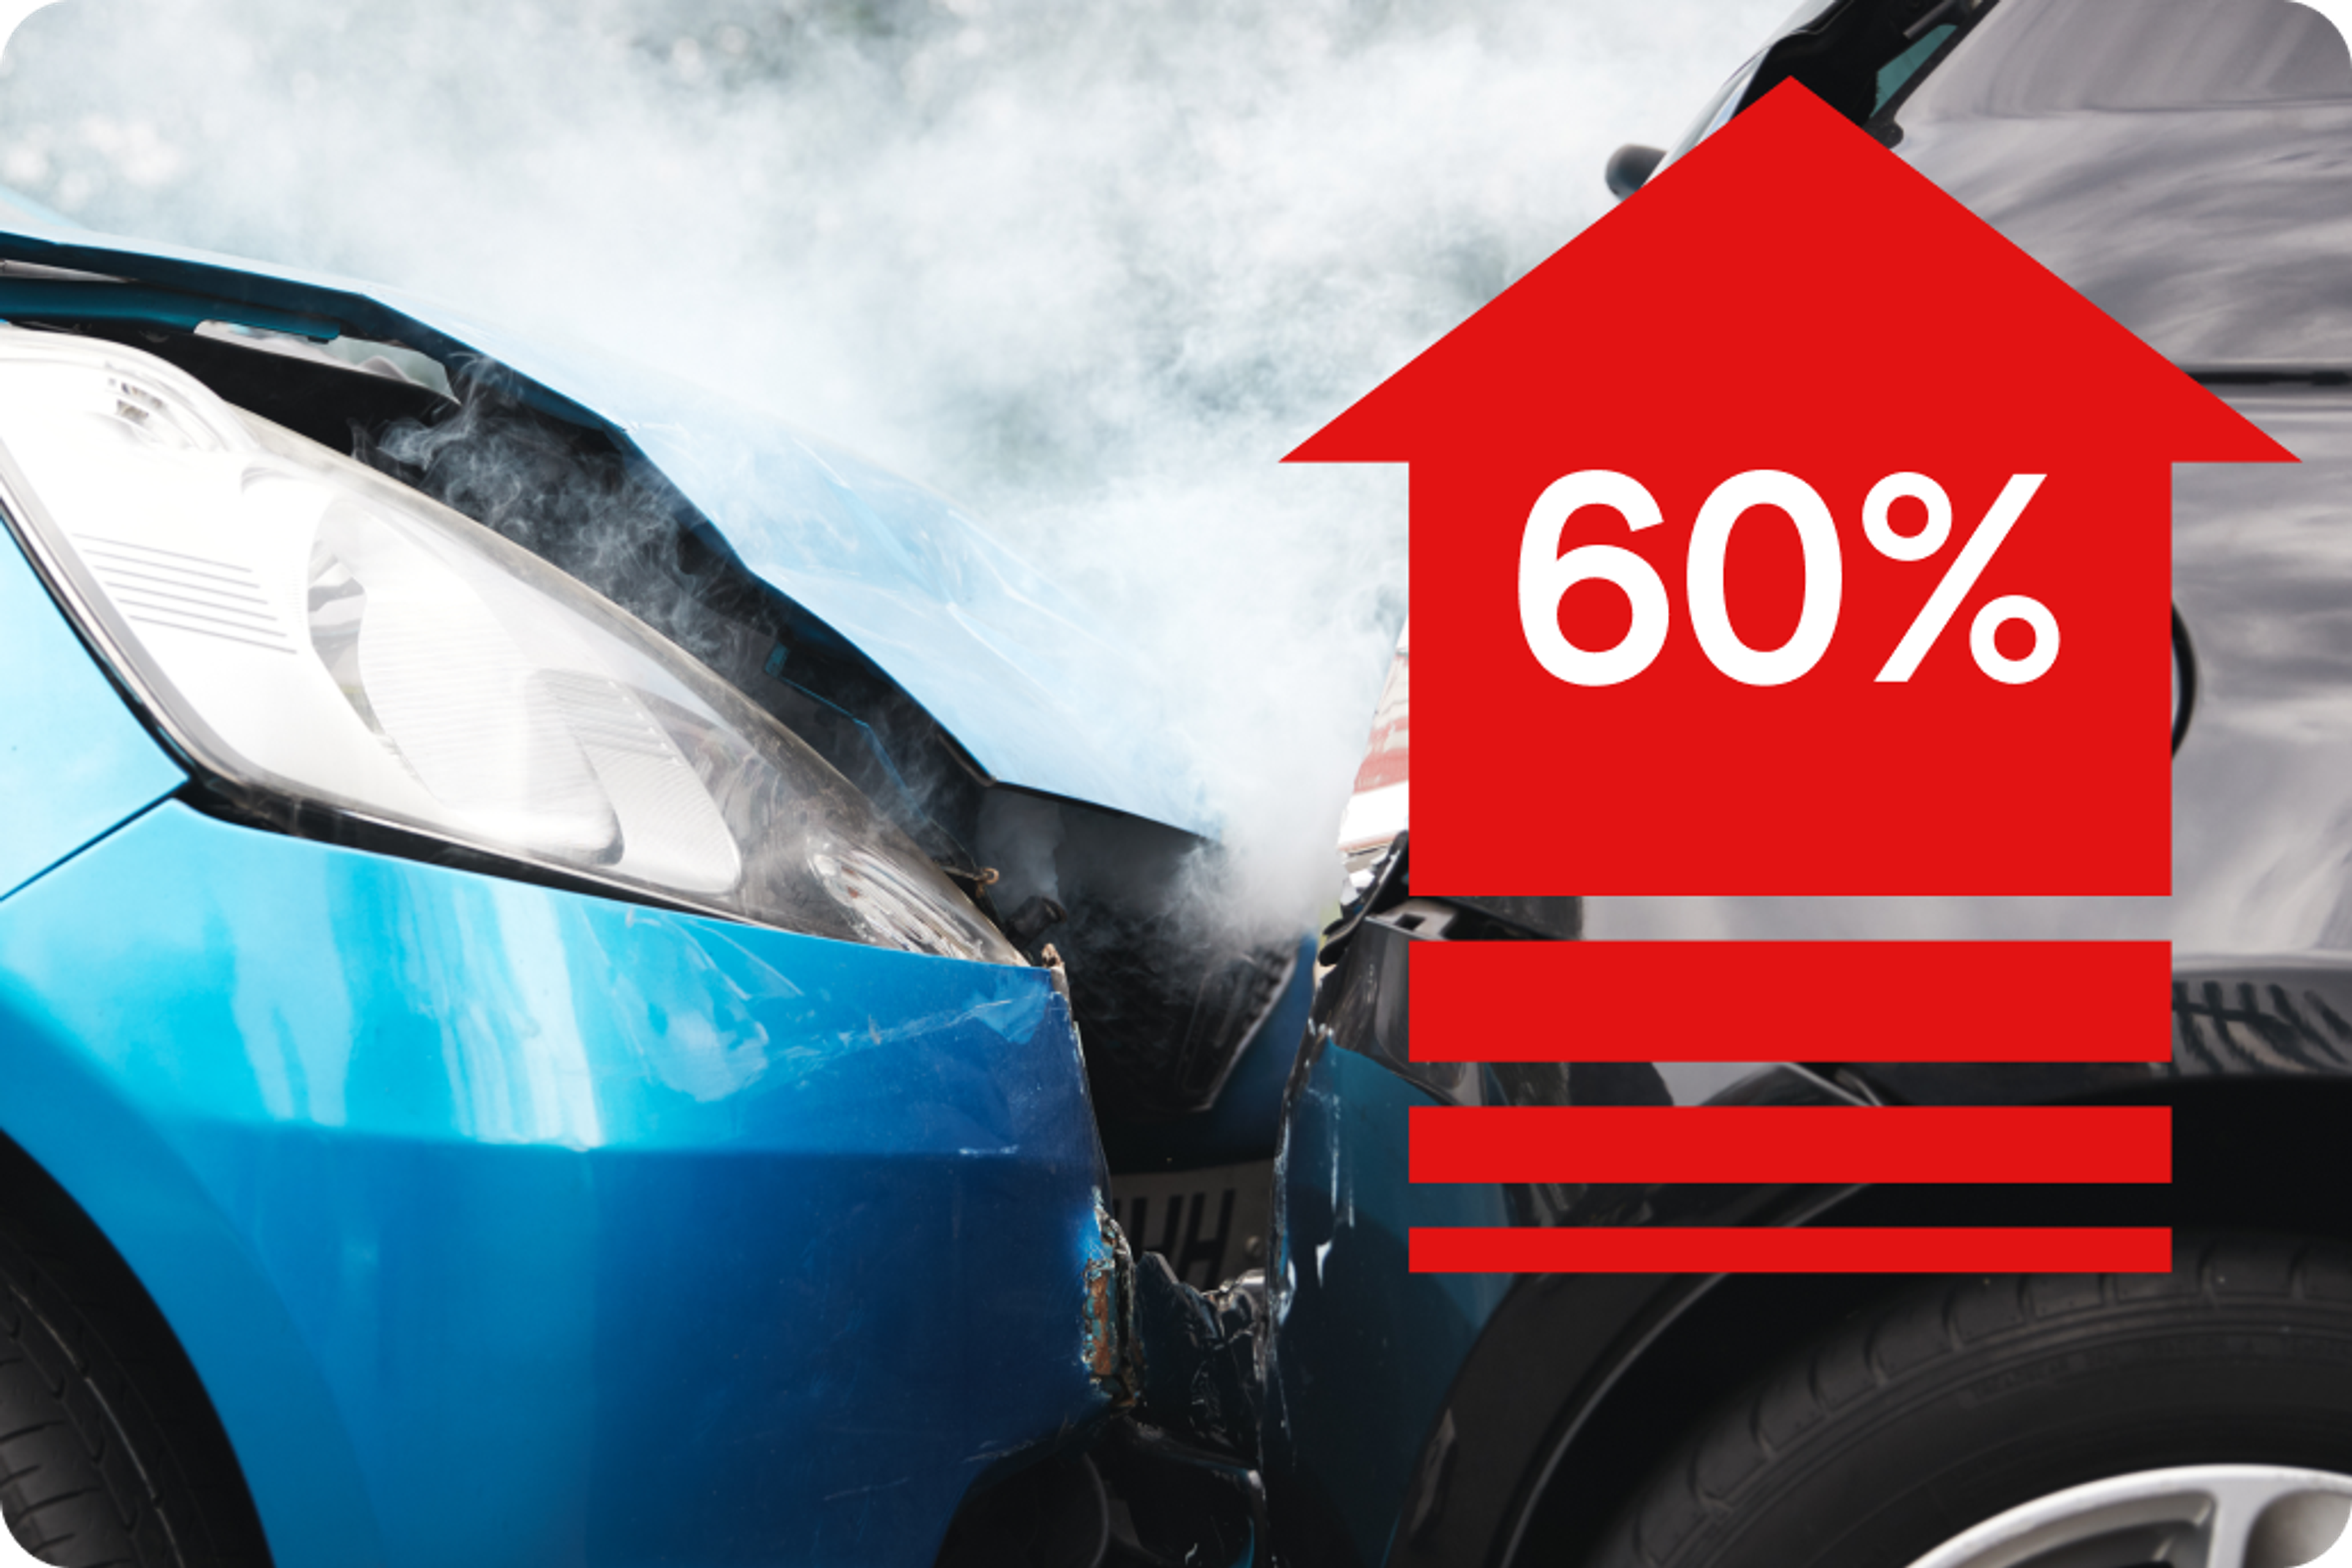
Dangerous driving on the rise
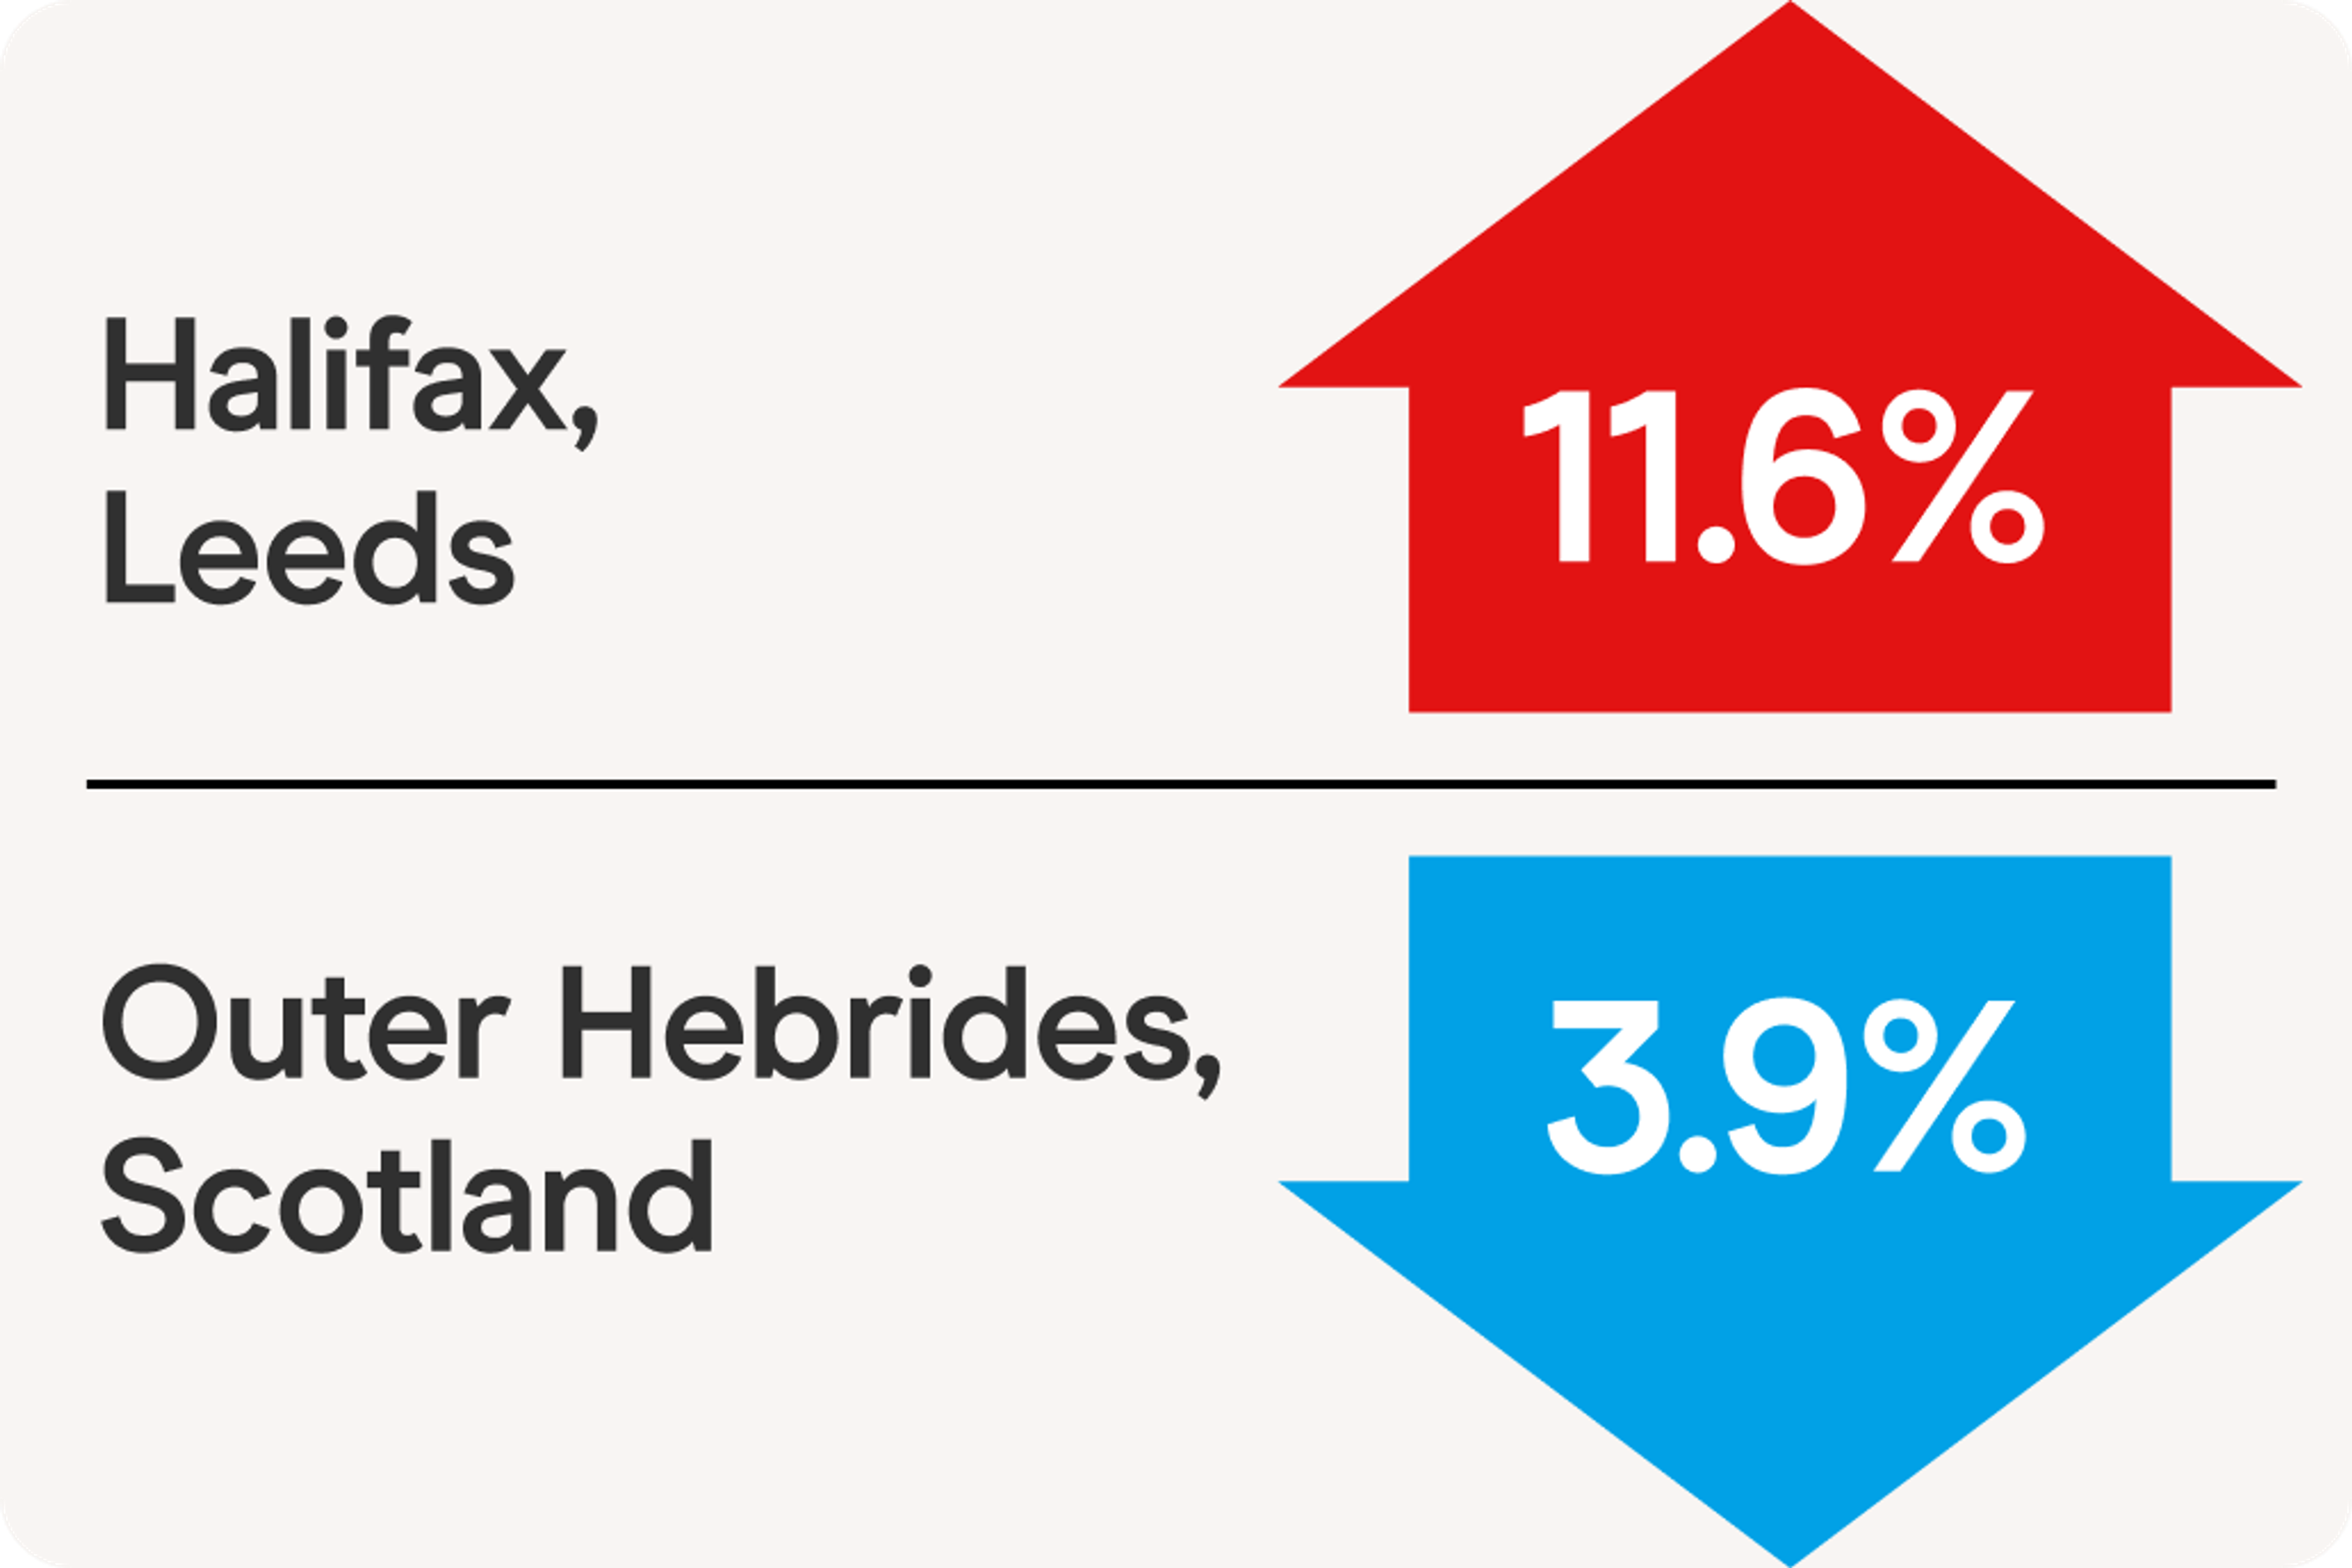
Regional danger zones
Enforcement is stepping up
From August 2025, new AI-powered cameras have been introduced to track repeat speeding offenders, with escalating fines and points for those caught multiple times [2].

What the law says
Penalty points normally stay on your licence for four years, but serious offences like drink driving or causing death by dangerous driving last 11 years [14]. If you hit 12 points within three years, you’re at risk of disqualification, although courts sometimes allow exceptions for “exceptional hardship” [14].

The bigger picture
For drivers, this matters because every offence has a cost beyond fines. Penalty points and bans make insurance more expensive, often for years. That’s why the same themes show up across our wider research, from gender car insurance statistics to car theft statistics and young driver insurance statistics.
Sources
[2] https://www.newgatesolicitors.com/uk-speeding-fine-changes-august-2025-ai-cameras/
[3] https://actionvisionzero.org/2025/02/19/avz-briefing-speed-enforcement-in-london/
[4] https://assets.publishing.service.gov.uk/
[5] https://www.tempcover.com/front-cover/news/dft-announces-latest-number-of-uk-speeding-offences
[11] https://www.dpp-law.com/driving-offences-statistics/
[12] https://connaughtlaw.com/uk-driving-offences-penalties-2025-legal-guide/
[13] https://tfl.gov.uk/cdn/static/cms/documents/roads-policing-enforcement-statistics-bulletin-201920.pdf
[14] https://www.cps.gov.uk/crime-info/driving-offences
View More UK Driving & Insurance Statistics
If you’re looking for deeper insights into UK driving behaviour, insurance trends and road safety, explore our full library of data-led statistics pages. Each guide includes detailed figures, expert commentary and actionable takeaways for drivers, tradespeople and delivery workers.
UK Driving Offence Statistics
Explore the latest UK driving offence UK statistics, including speeding, mobile phone offences, penalty points, age comparisons and regional hotspots.
Food Delivery Statistics
Dive into comprehensive food delivery UK statistics covering rider demographics, risk patterns, earnings and the growth of the UK delivery sector.
UK Van Driver Statistics
Learn more about the nation’s tradespeople through our detailed van driver statistics, including incident rates, mileage patterns and regional breakdowns.
Car Theft Statistics
Understand current UK trends, risk factors and the most-targeted models in our full car theft UK statistics guide.
Young Driver Statistics
Get insights into telematics behaviour, pass rates, claims data and insurance trends in our latest young driver UK statistics report.
Gender Car Insurance Statistics
Discover how premiums vary across age groups and regions in our detailed UK gender car insurance statistics breakdown.