New and young driver statistics UK

Who are young drivers?
Across the pond, young people aged 15–20 represent just 5% of licensed drivers in the US, but are involved in 8.4% of all fatal traffic crashes.
Similarly, in Northern Ireland, the Department of Infrastructure says the disparity is equally as stark: while only 8% of licence holders are aged 17–23, this group is responsible for 21% of fatal or serious crashes.
How do young drivers perform in tests?
Struggling with the theory test
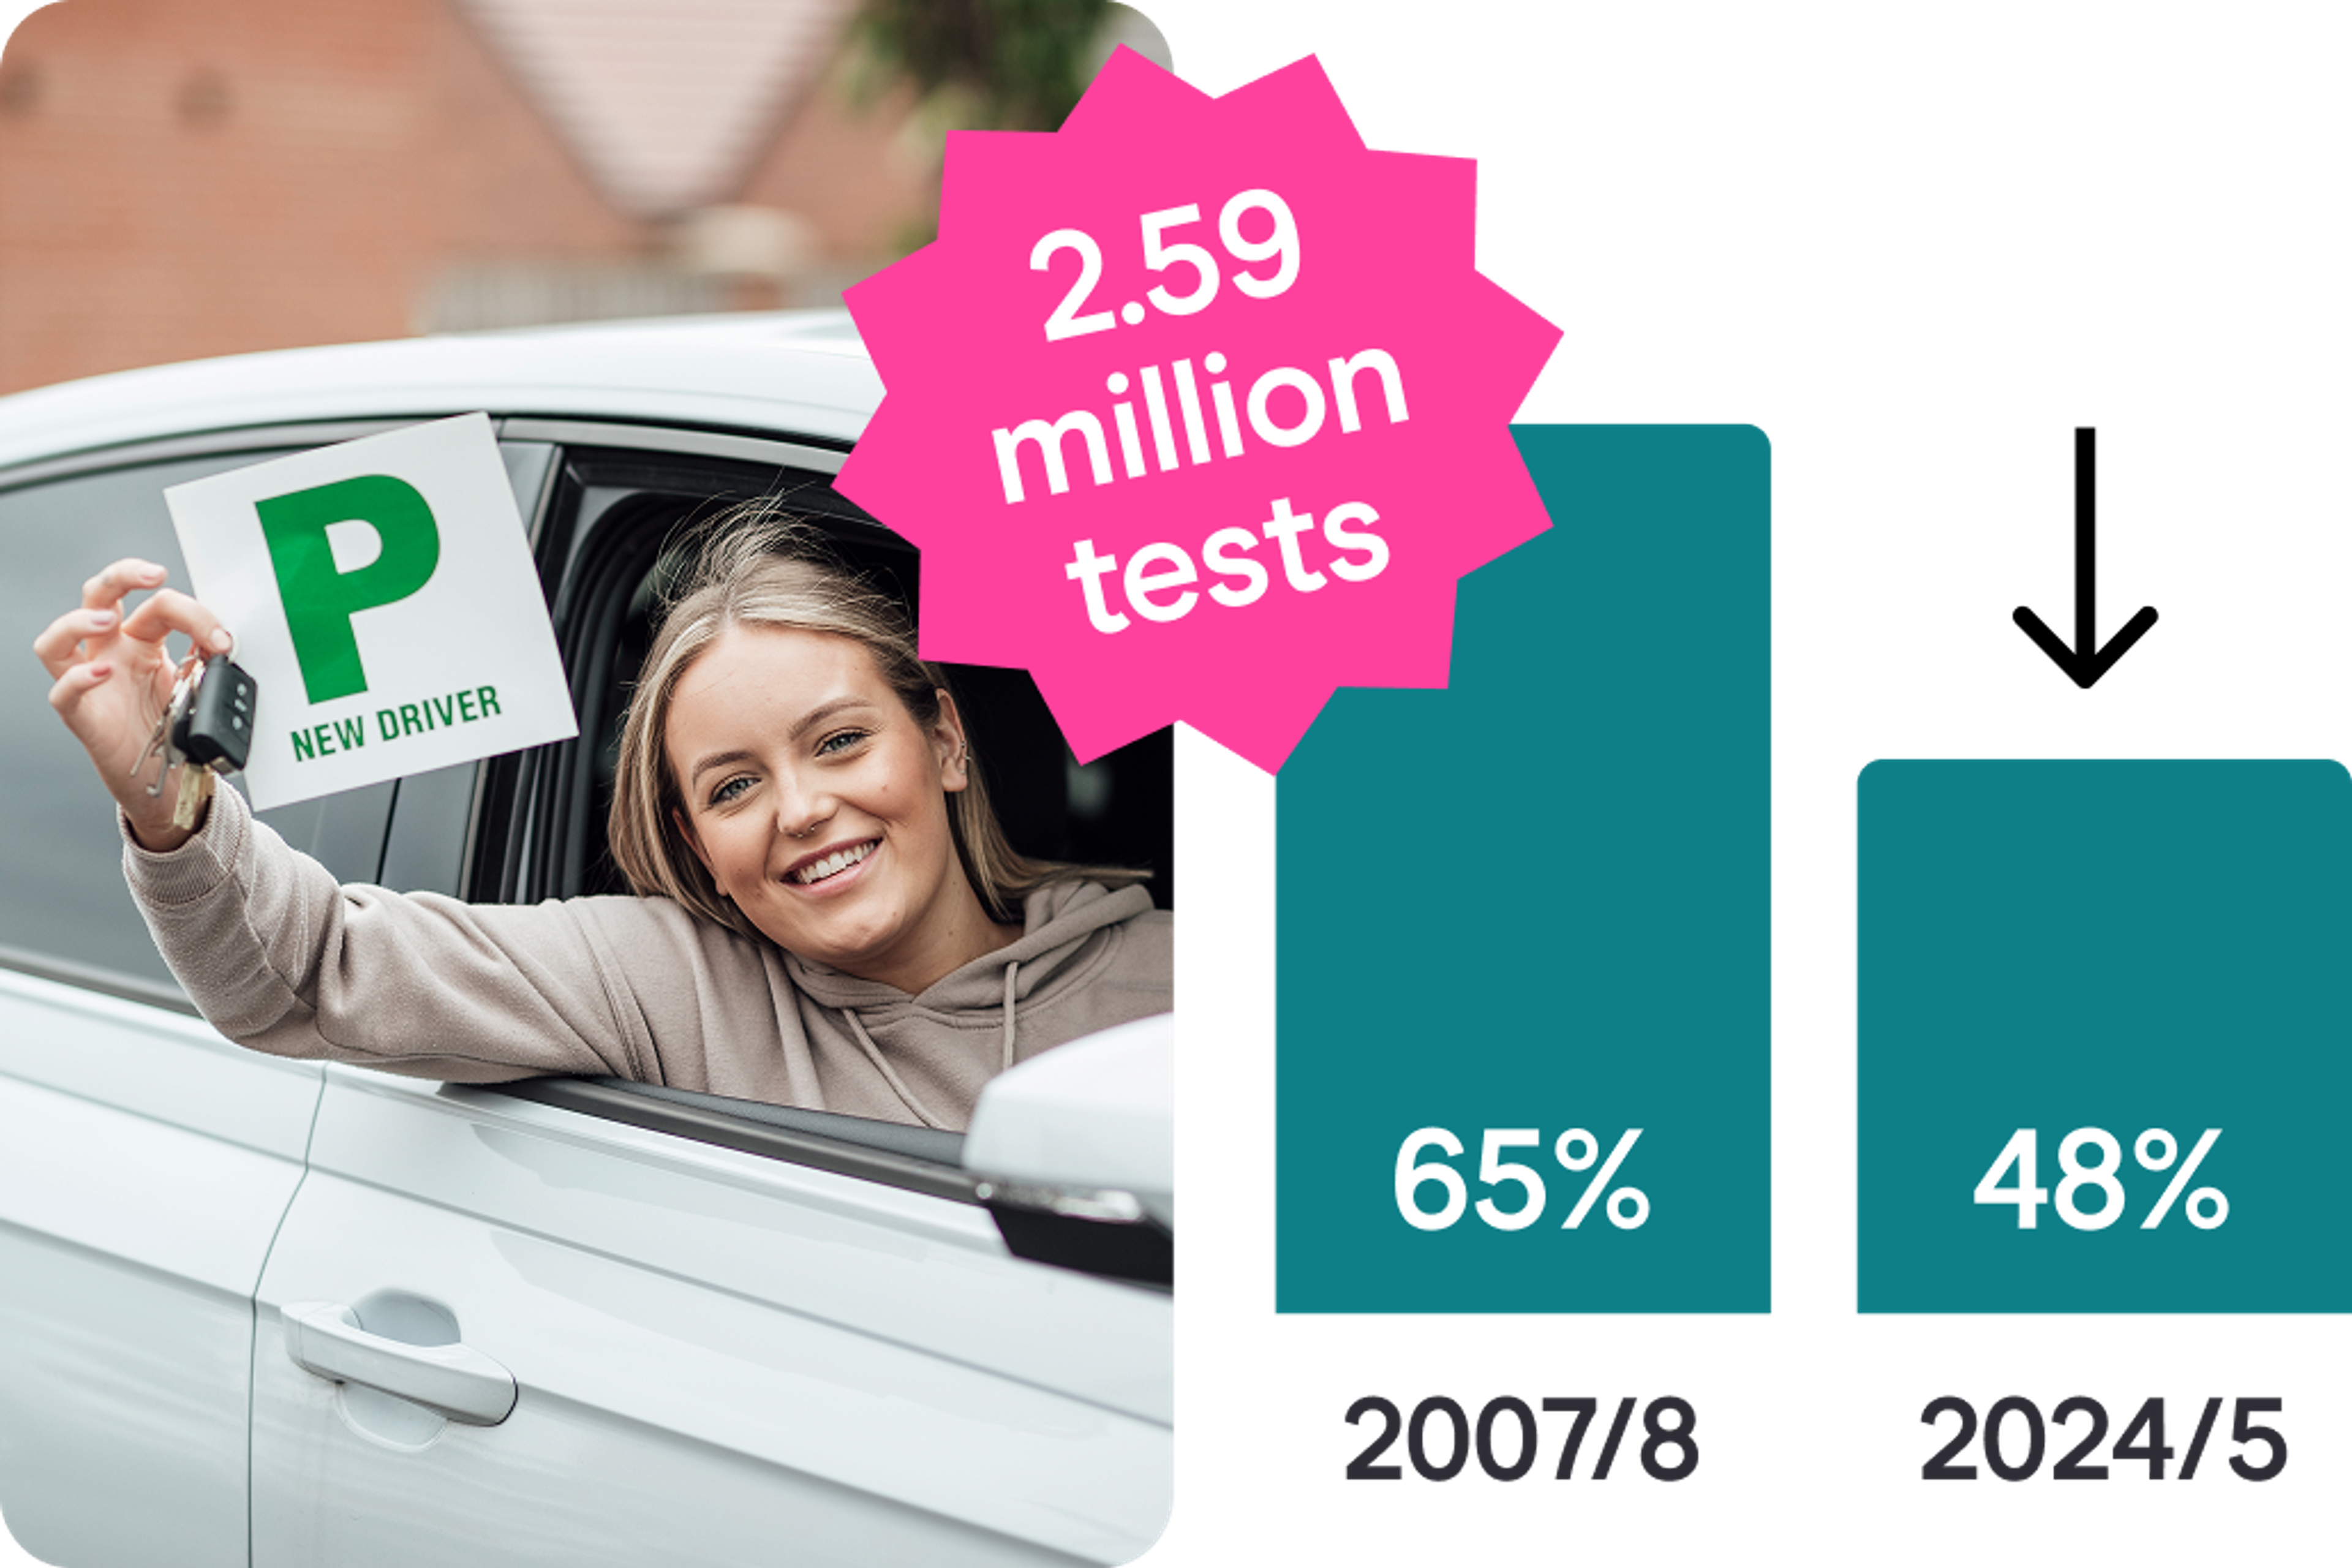
Meanwhile, in 2023/24, the number of theory tests hit a record high of 2.59 million, it adds.
Practical test trends
According to the Independent, from April to September 2024, close to a million practical exams were undertaken, with approximately 445,000 passes – a national average of 48.5%.
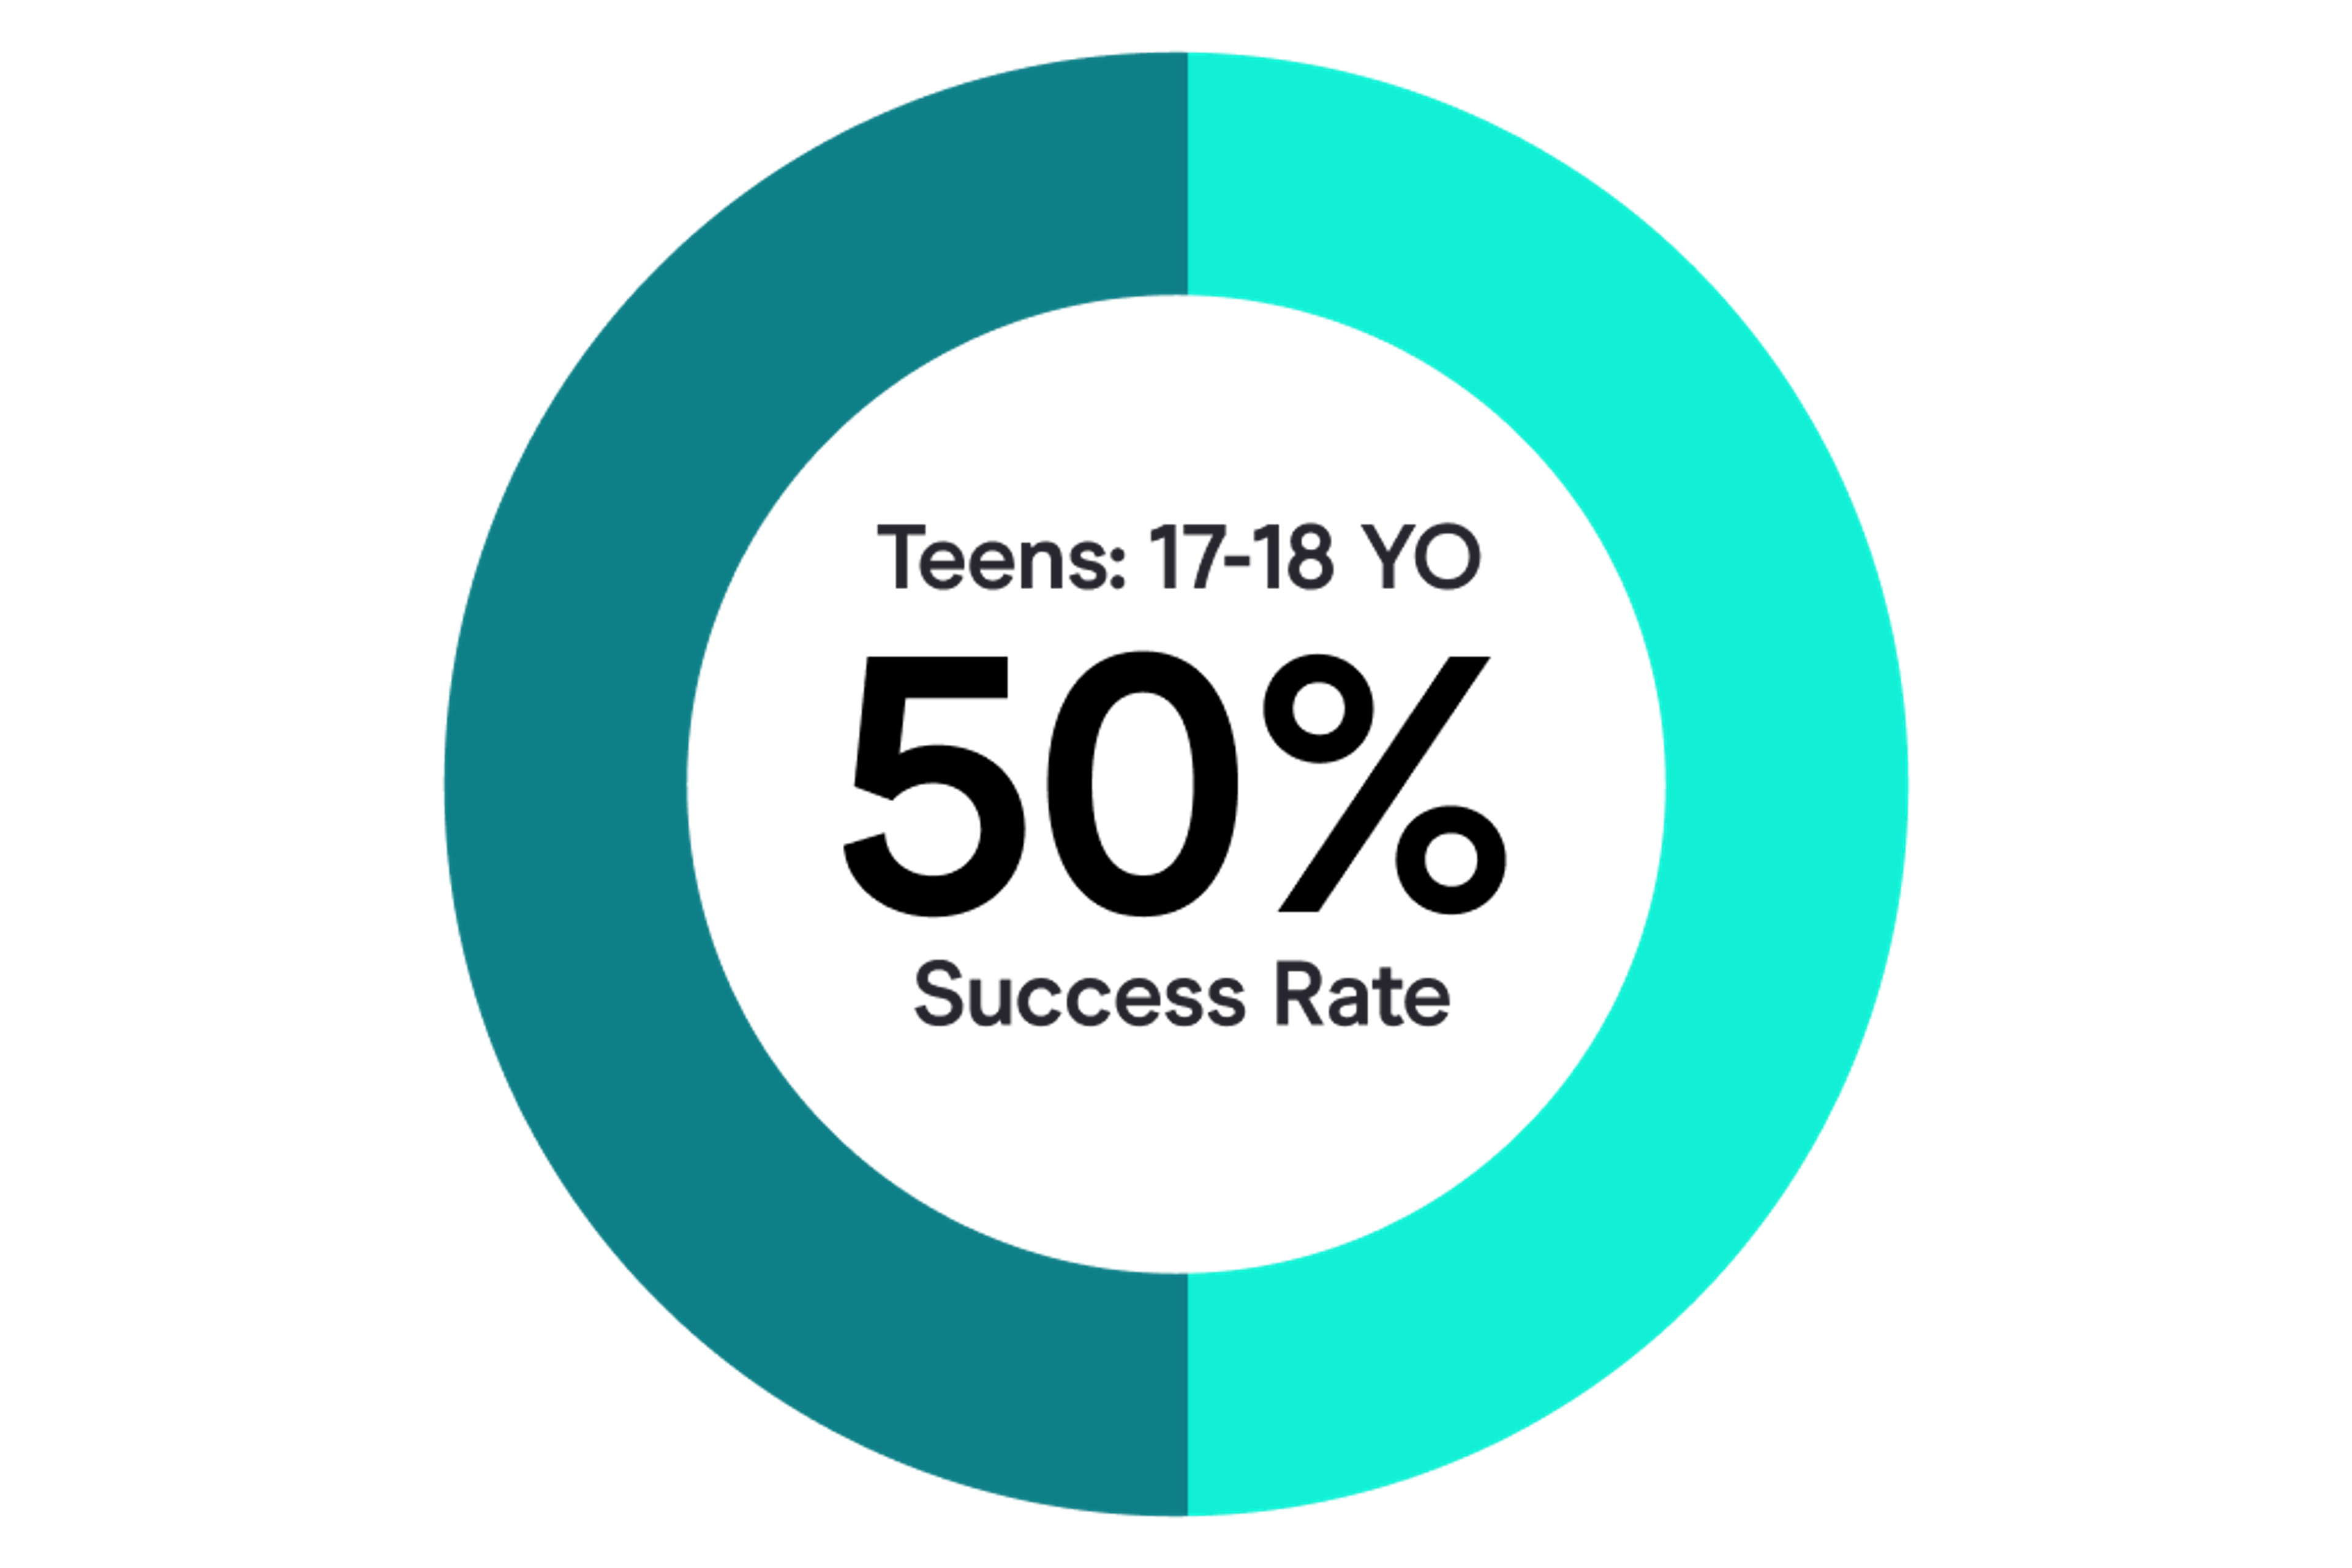
Data shows that teenagers aged 17 and 18 are most likely to pass on their first attempt, with a 50% success rate.
The first year behind the wheel
The first month
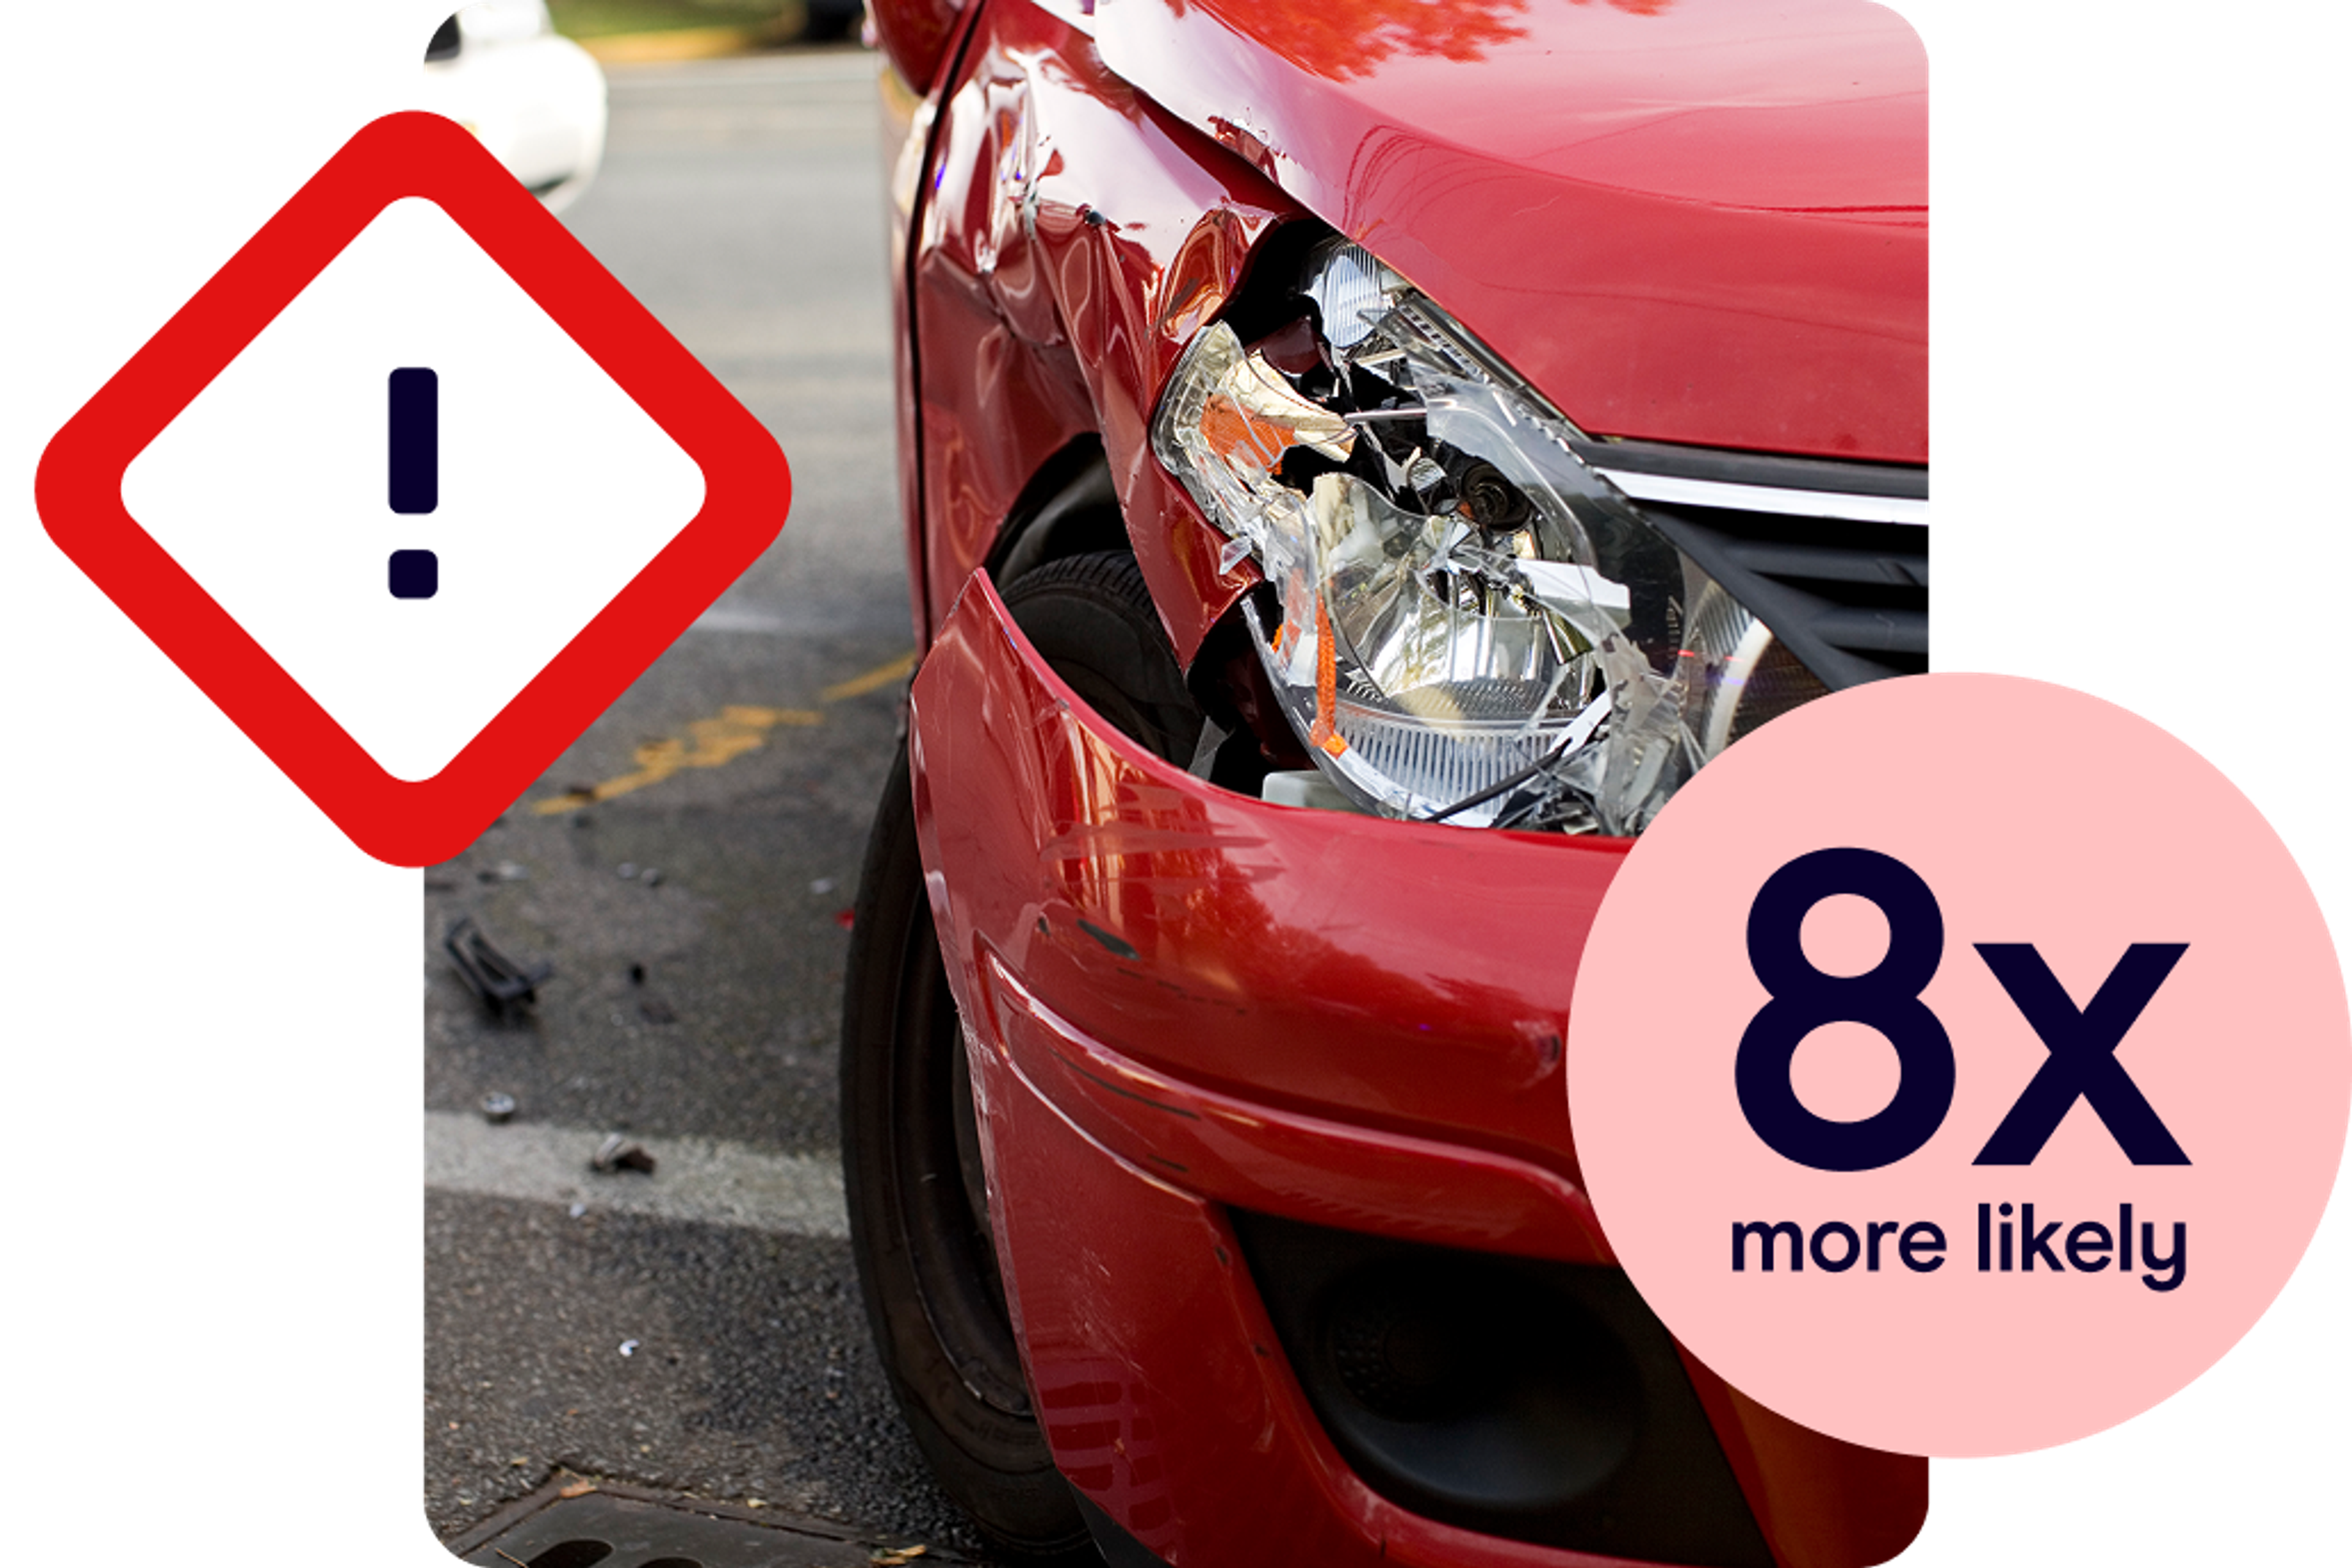
In fact, a study by the National Institute of Health, says they’re eight times more likely to be in a crash or near miss in the first three months of solo driving compared to their time as learners.
More than half of crashes in the first month stem from just three issues: speeding, failing to yield, and distraction.

First-year crash stats
It adds that among 18-to-24-year-olds, that figure climbs to 26.1%, and for 25-to-34-year-olds, this stands at 27.7%.
Furthermore, for those over 35-years-old, the number of accidents fell to 20%, and 16.6% of new drivers over 55-years-old being involved in one.
Fatal crash risk: A global comparison

In the US
In 2021, 2,116 young US drivers aged 15–20 lost their lives in crashes – an 11% rise from 2020[2].
Despite being just 3.7% of licensed drivers, teens aged 15–19 were involved in 7% of fatal crashes in 2022, amounting to 2,883 deaths – almost eight every day[12].
Fatal crash risk peaks at age 19, with 9.4 driver deaths and 4.6 passenger deaths per 100,000 miles driven[12].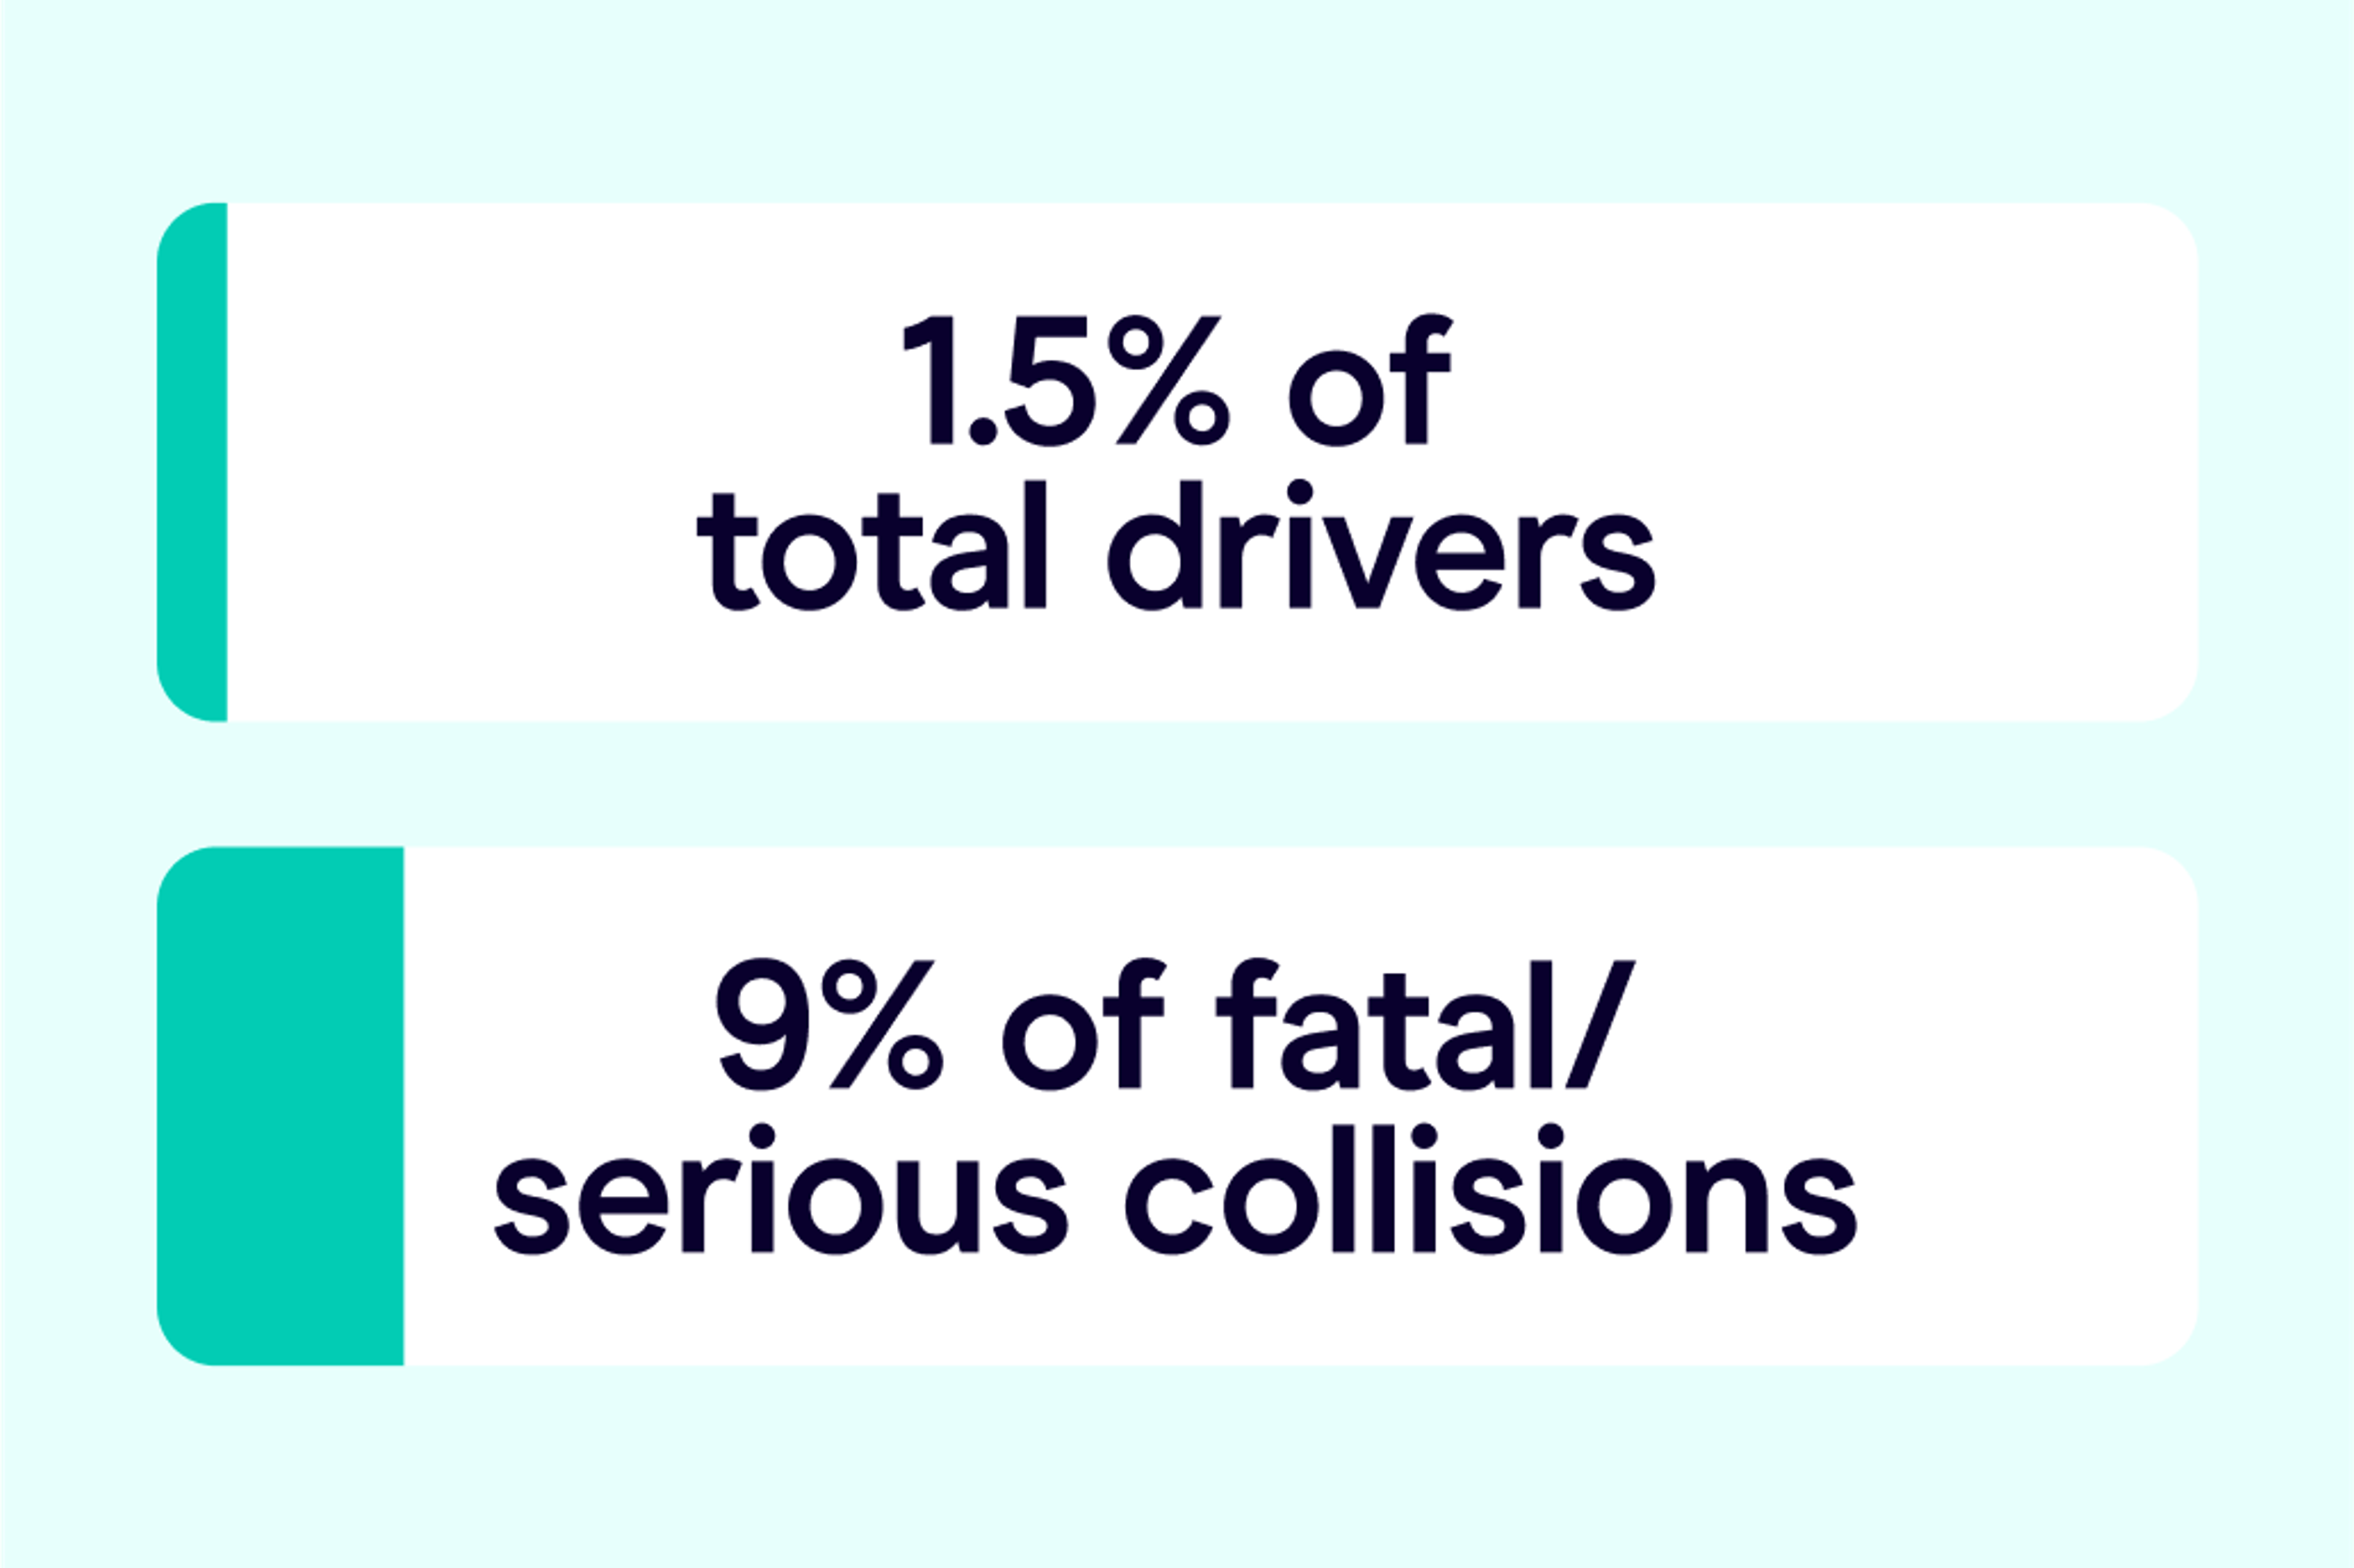
In the UK
In 2023, 1,624 people were killed on UK roads – a 5% drop from 2022[13].
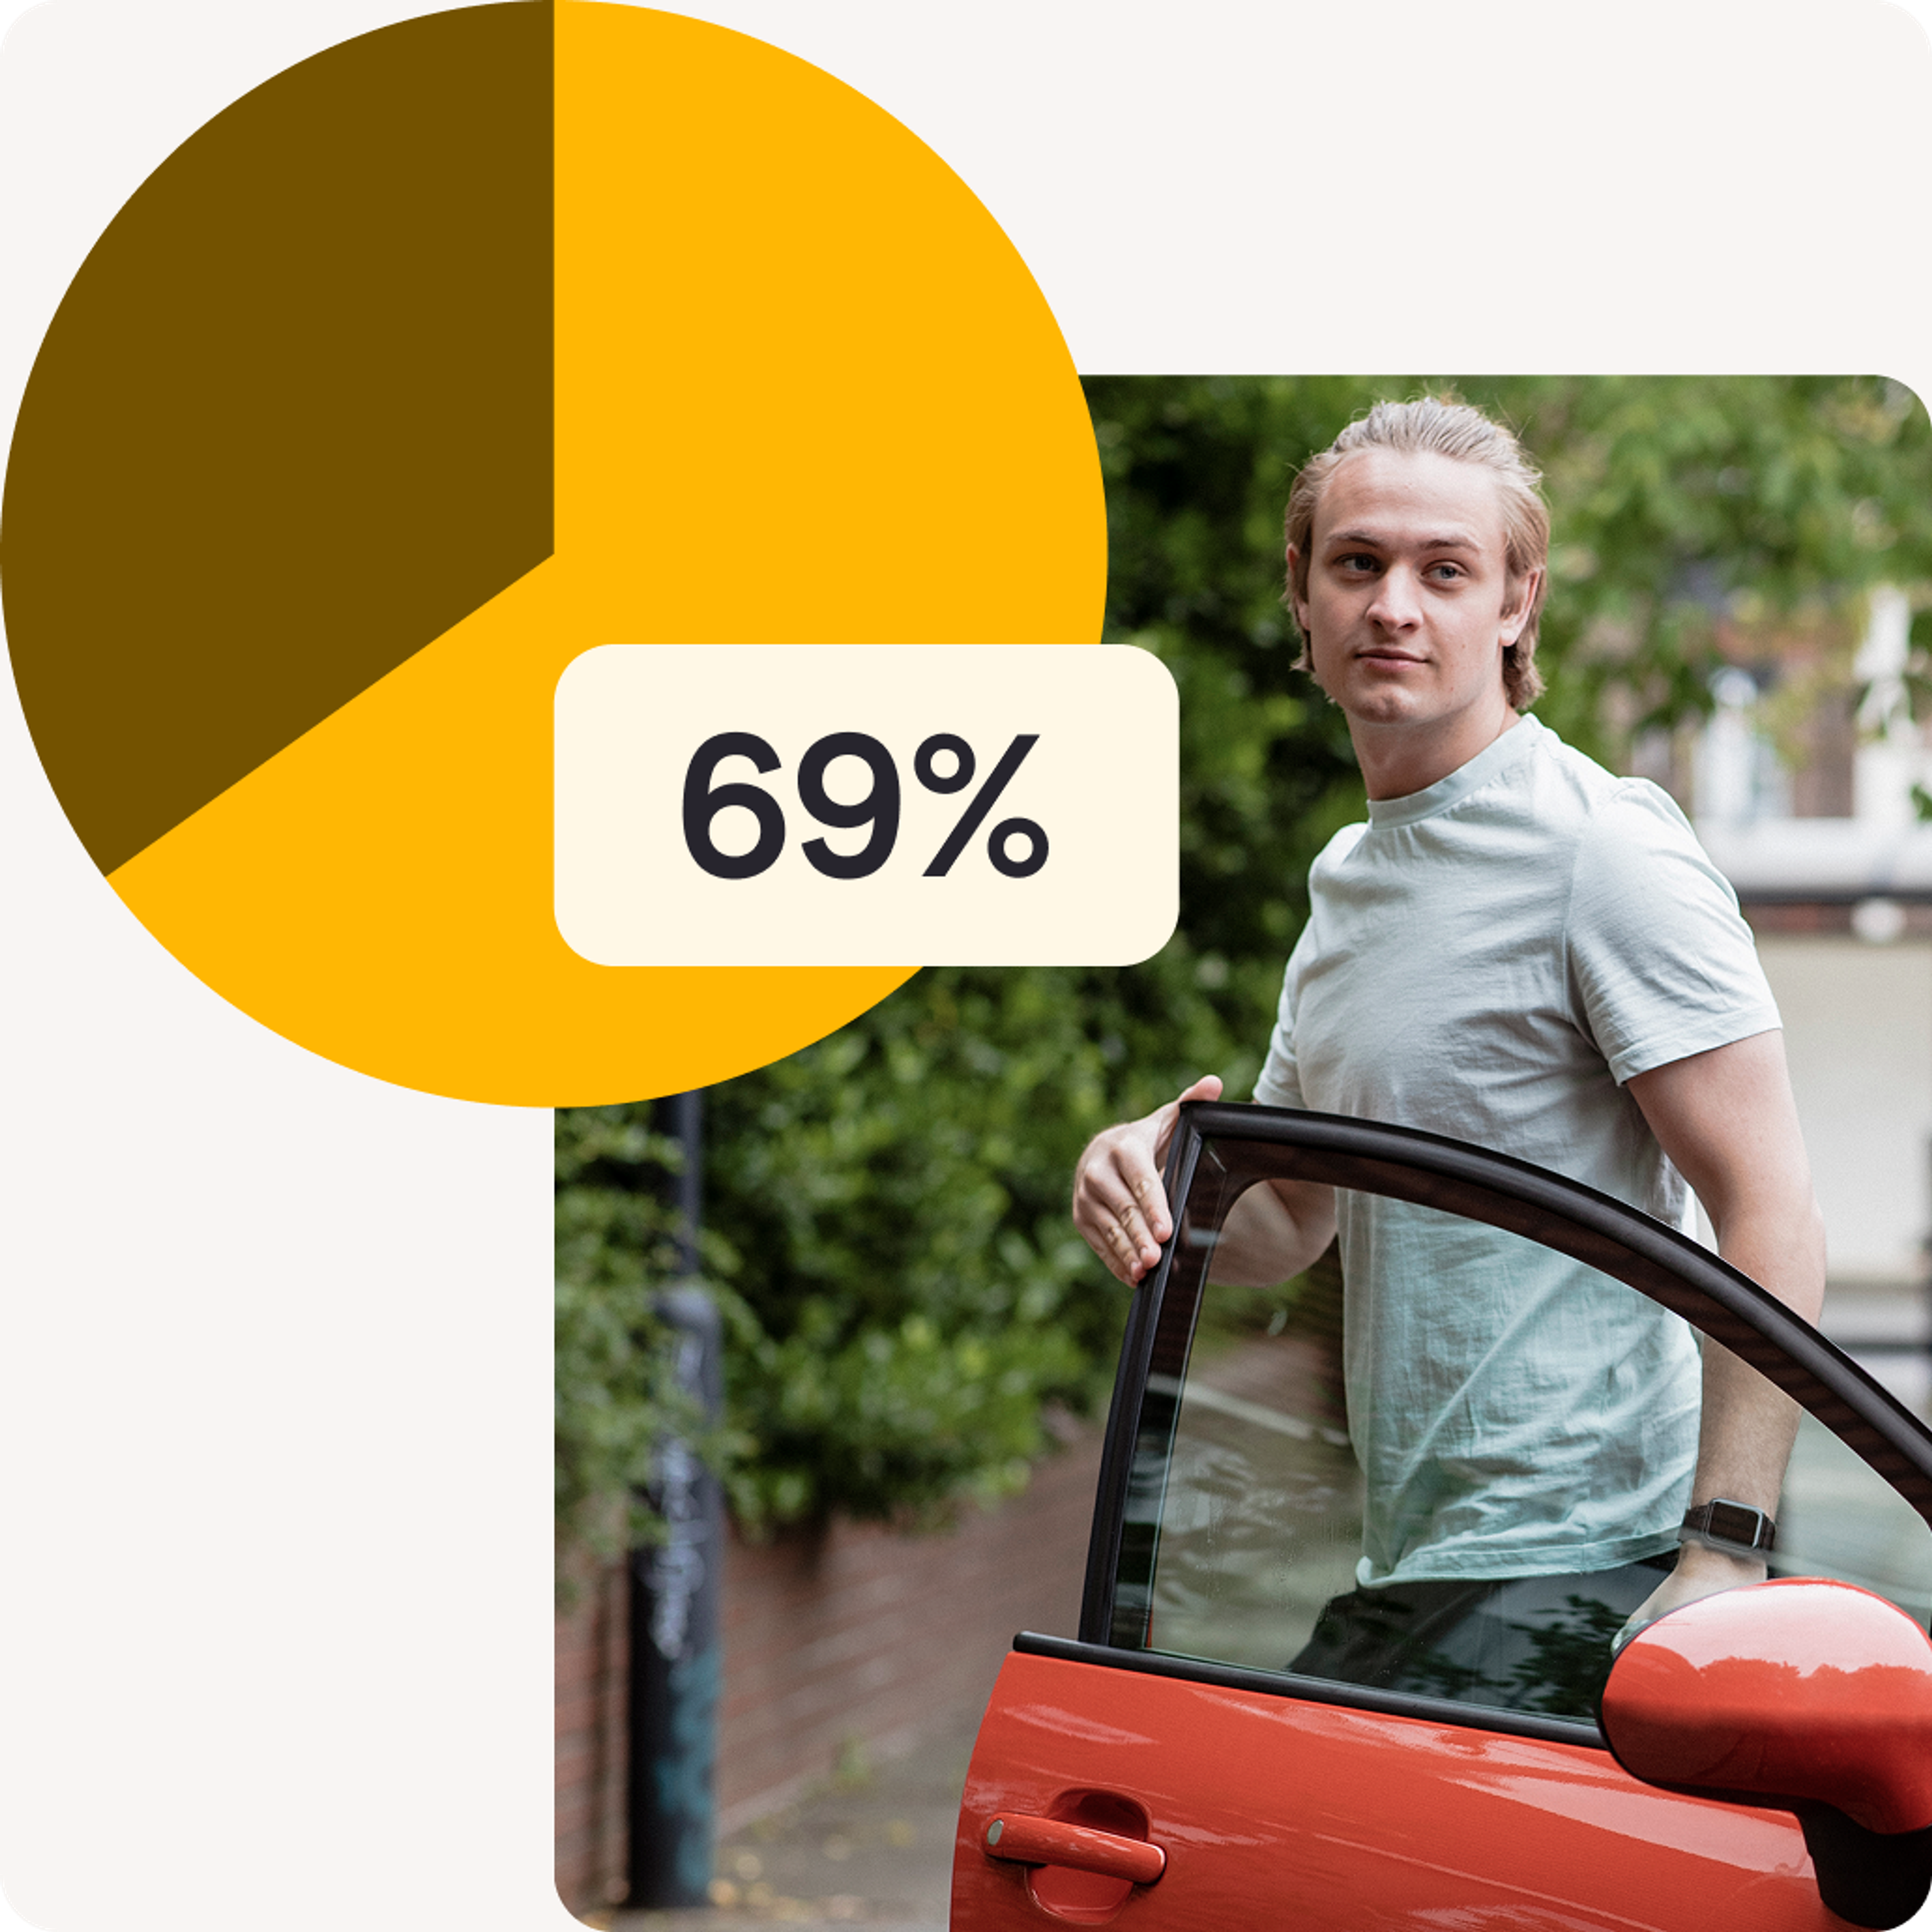
Yet 17-to-19-year-olds, who make up only 1.5% of drivers, are involved in 9% of all fatal or serious collisions[11].
Gender gaps in young driver risk
In 2021, fatal crash involvement rates per 100,000 drivers were 60.28 for young males and 25.51 for young females[2].
As a result of this, insurance costs tend to reflect this disparity in premiums: young women pay around 30% less than their male counterparts[1].
When are crashes most likely?

Nighttime driving
Men aged 17–20 are seven times more likely to be in a crash than the average male driver, but between 2am and 5am, that figure jumps to 17 times more likely[14].
A third of fatal teen crashes happen before midnight, and 45% of all teen traffic fatalities occur between 9pm and 6am[12][15].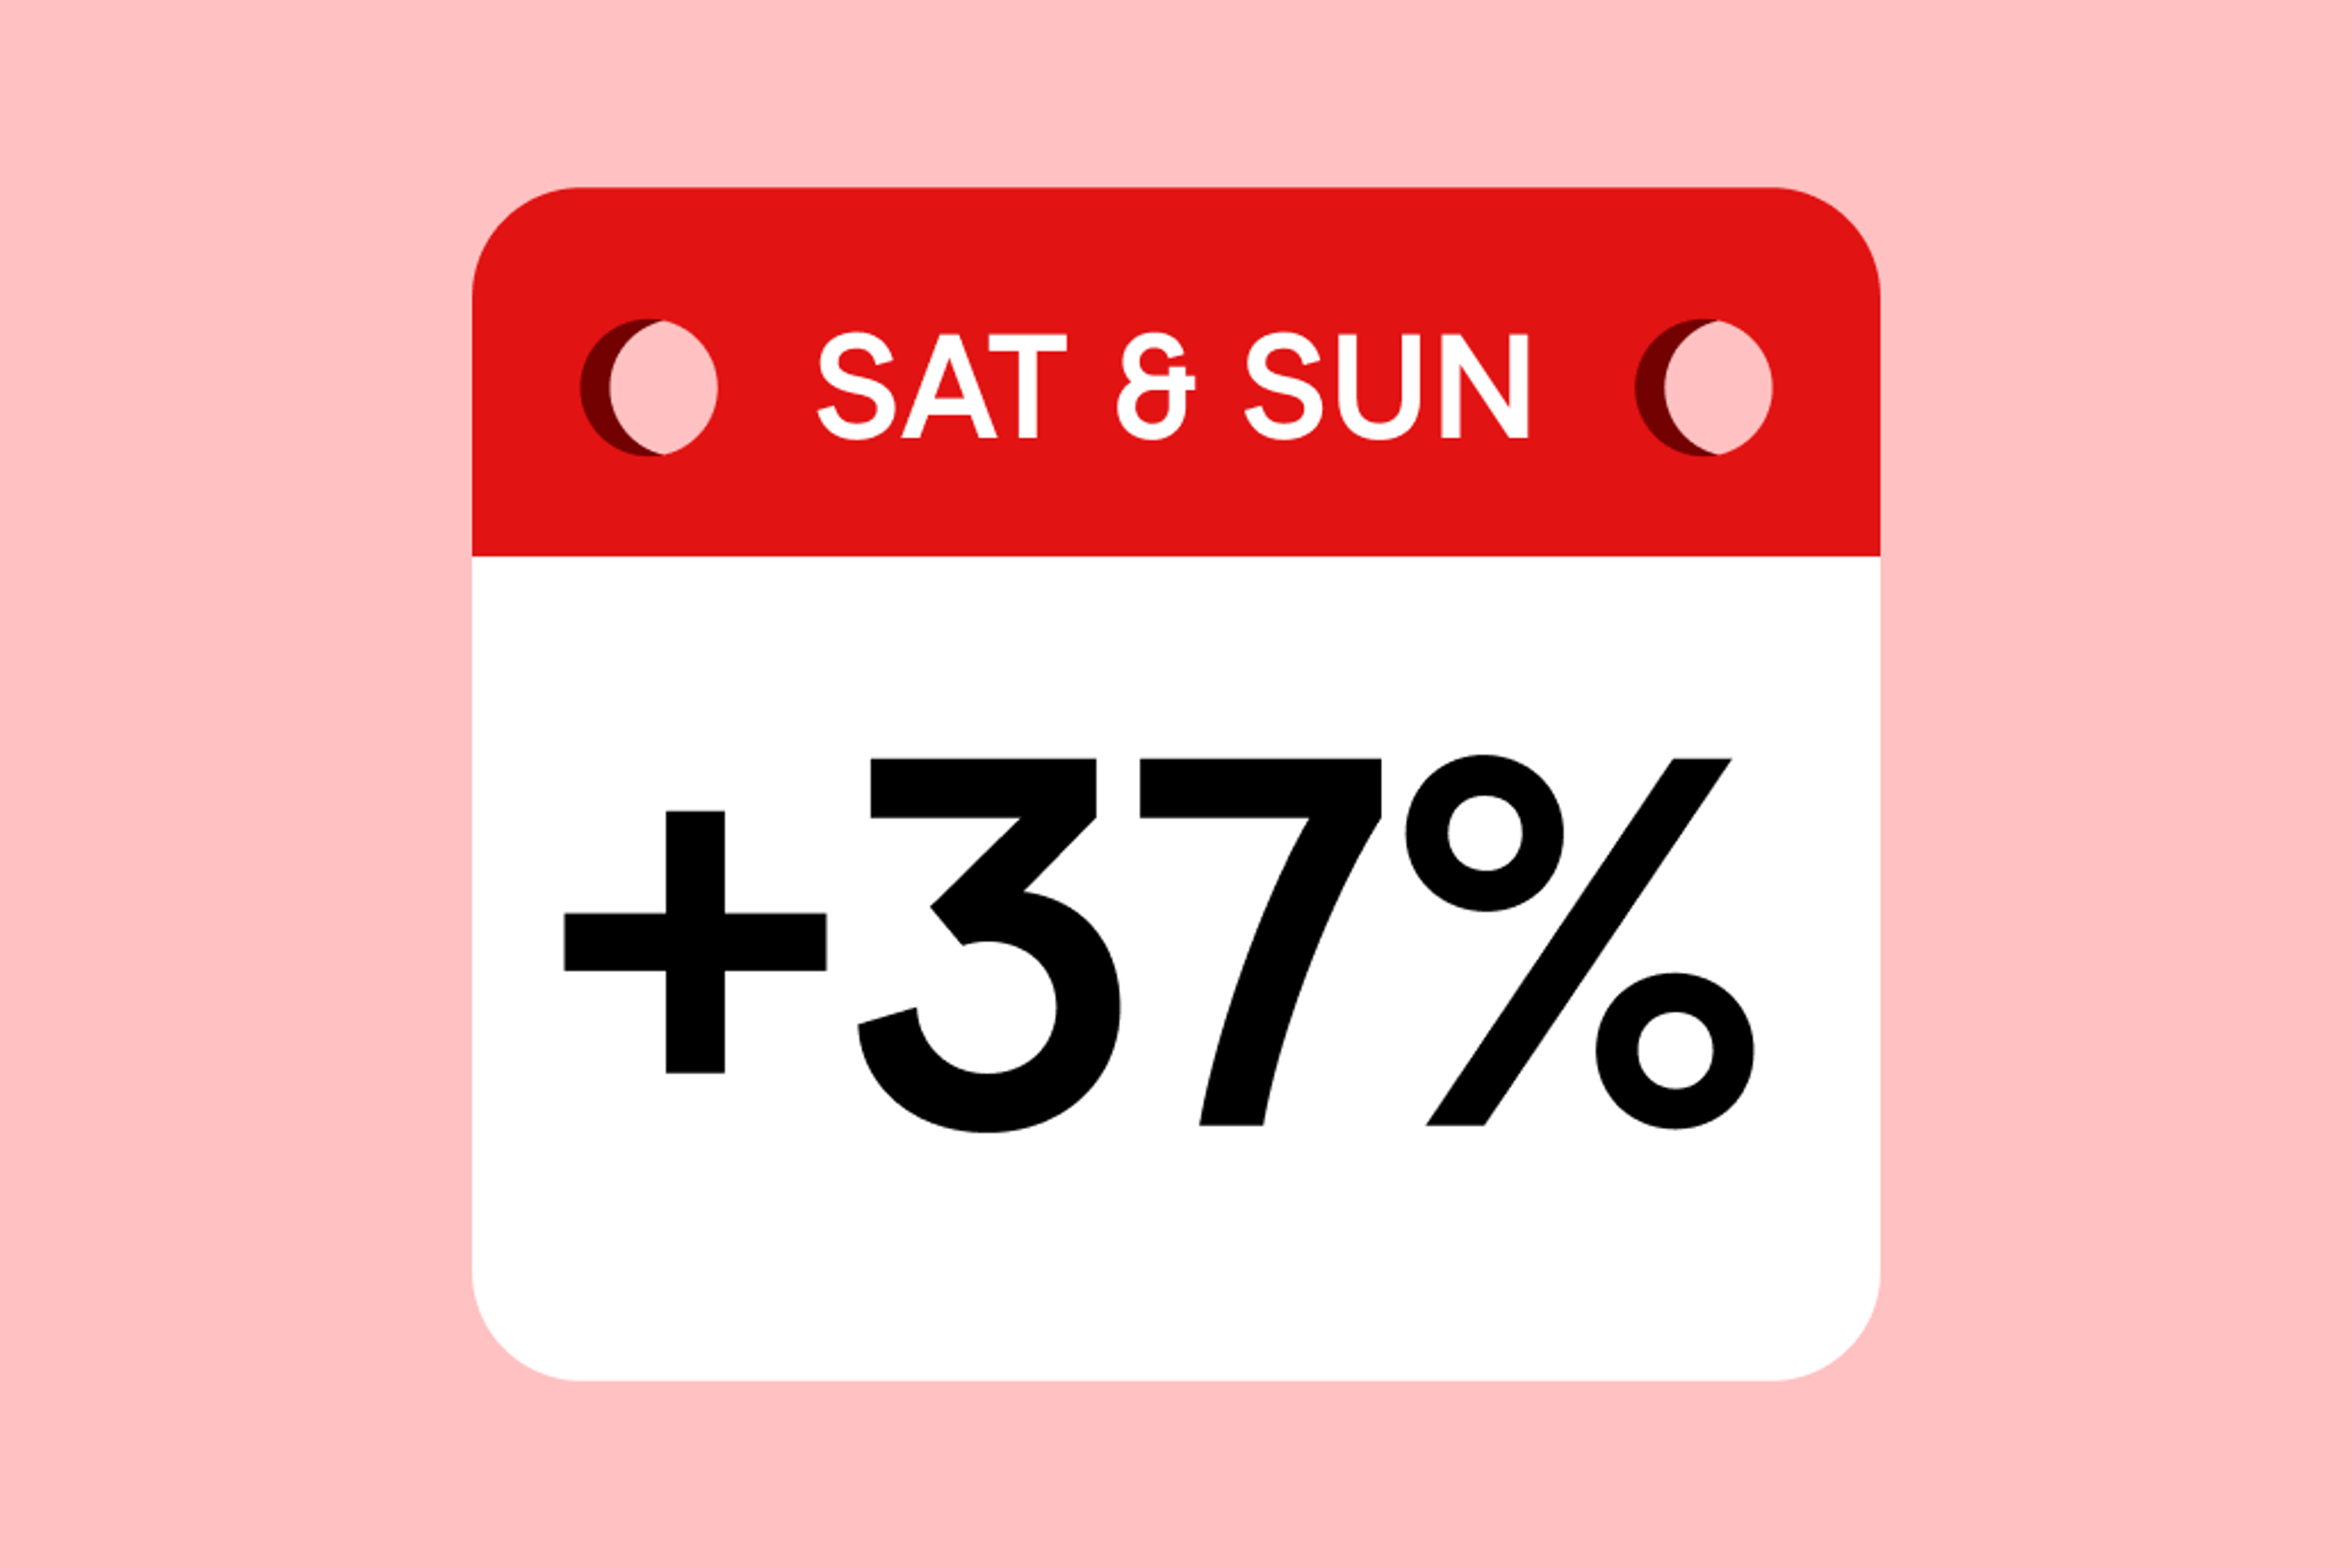
Weekends and seasonal peaks
Saturday and Sunday are often cited as the most ‘deadliest’ days, as they accounted for 37% of teen traffic fatalities in 2022[12].
October sees the highest number of fatalities, perhaps as more people are out in the lead up to the festive season, while January and February – months where people are trying to abstain from alcohol – record the fewest[12].
Distractions behind the wheel

Mobile use and multitasking
While illegal, more than a third of new teen drivers use handheld phones while driving, and 40% speed regularly[16].
Around 50% admit to texting while driving; 33% check social media weekly, and 23% say they sometimes watch videos behind the wheel[17].
Crash consequences
Distractions contribute to 58% of observed teen crashes[18], and in 2022, distraction-related incidents caused 193 teen deaths – 7% of the total[18].
Back in 2013, distracted driving was the cause of 10% of fatal crashes involving 15-to-19-year-olds, which is the highest of any age group[19].

The impact of passengers
In 2022, over 56% of teens who died as passengers were in vehicles driven by fellow teens[18].

Alcohol and young drivers
Underage drinking
Peer influence

Rural versus urban risk
While younger teens (ages 10–15) crash more in rural areas overall, older teens (16–18) crash slightly more in urban settings[23].
Data shows that rural crashes often involve single vehicles; happen late at night; and commonly result from crossing centre lines or failing to yield[23].
Sleep and crash likelihood
Losing weekend sleep increases the risk of run-off-road crashes by 55%[24]. AA data shows that sleeping fewer than four hours before driving raises crash risk 11.5-fold[25].
Seatbelt usage and survival
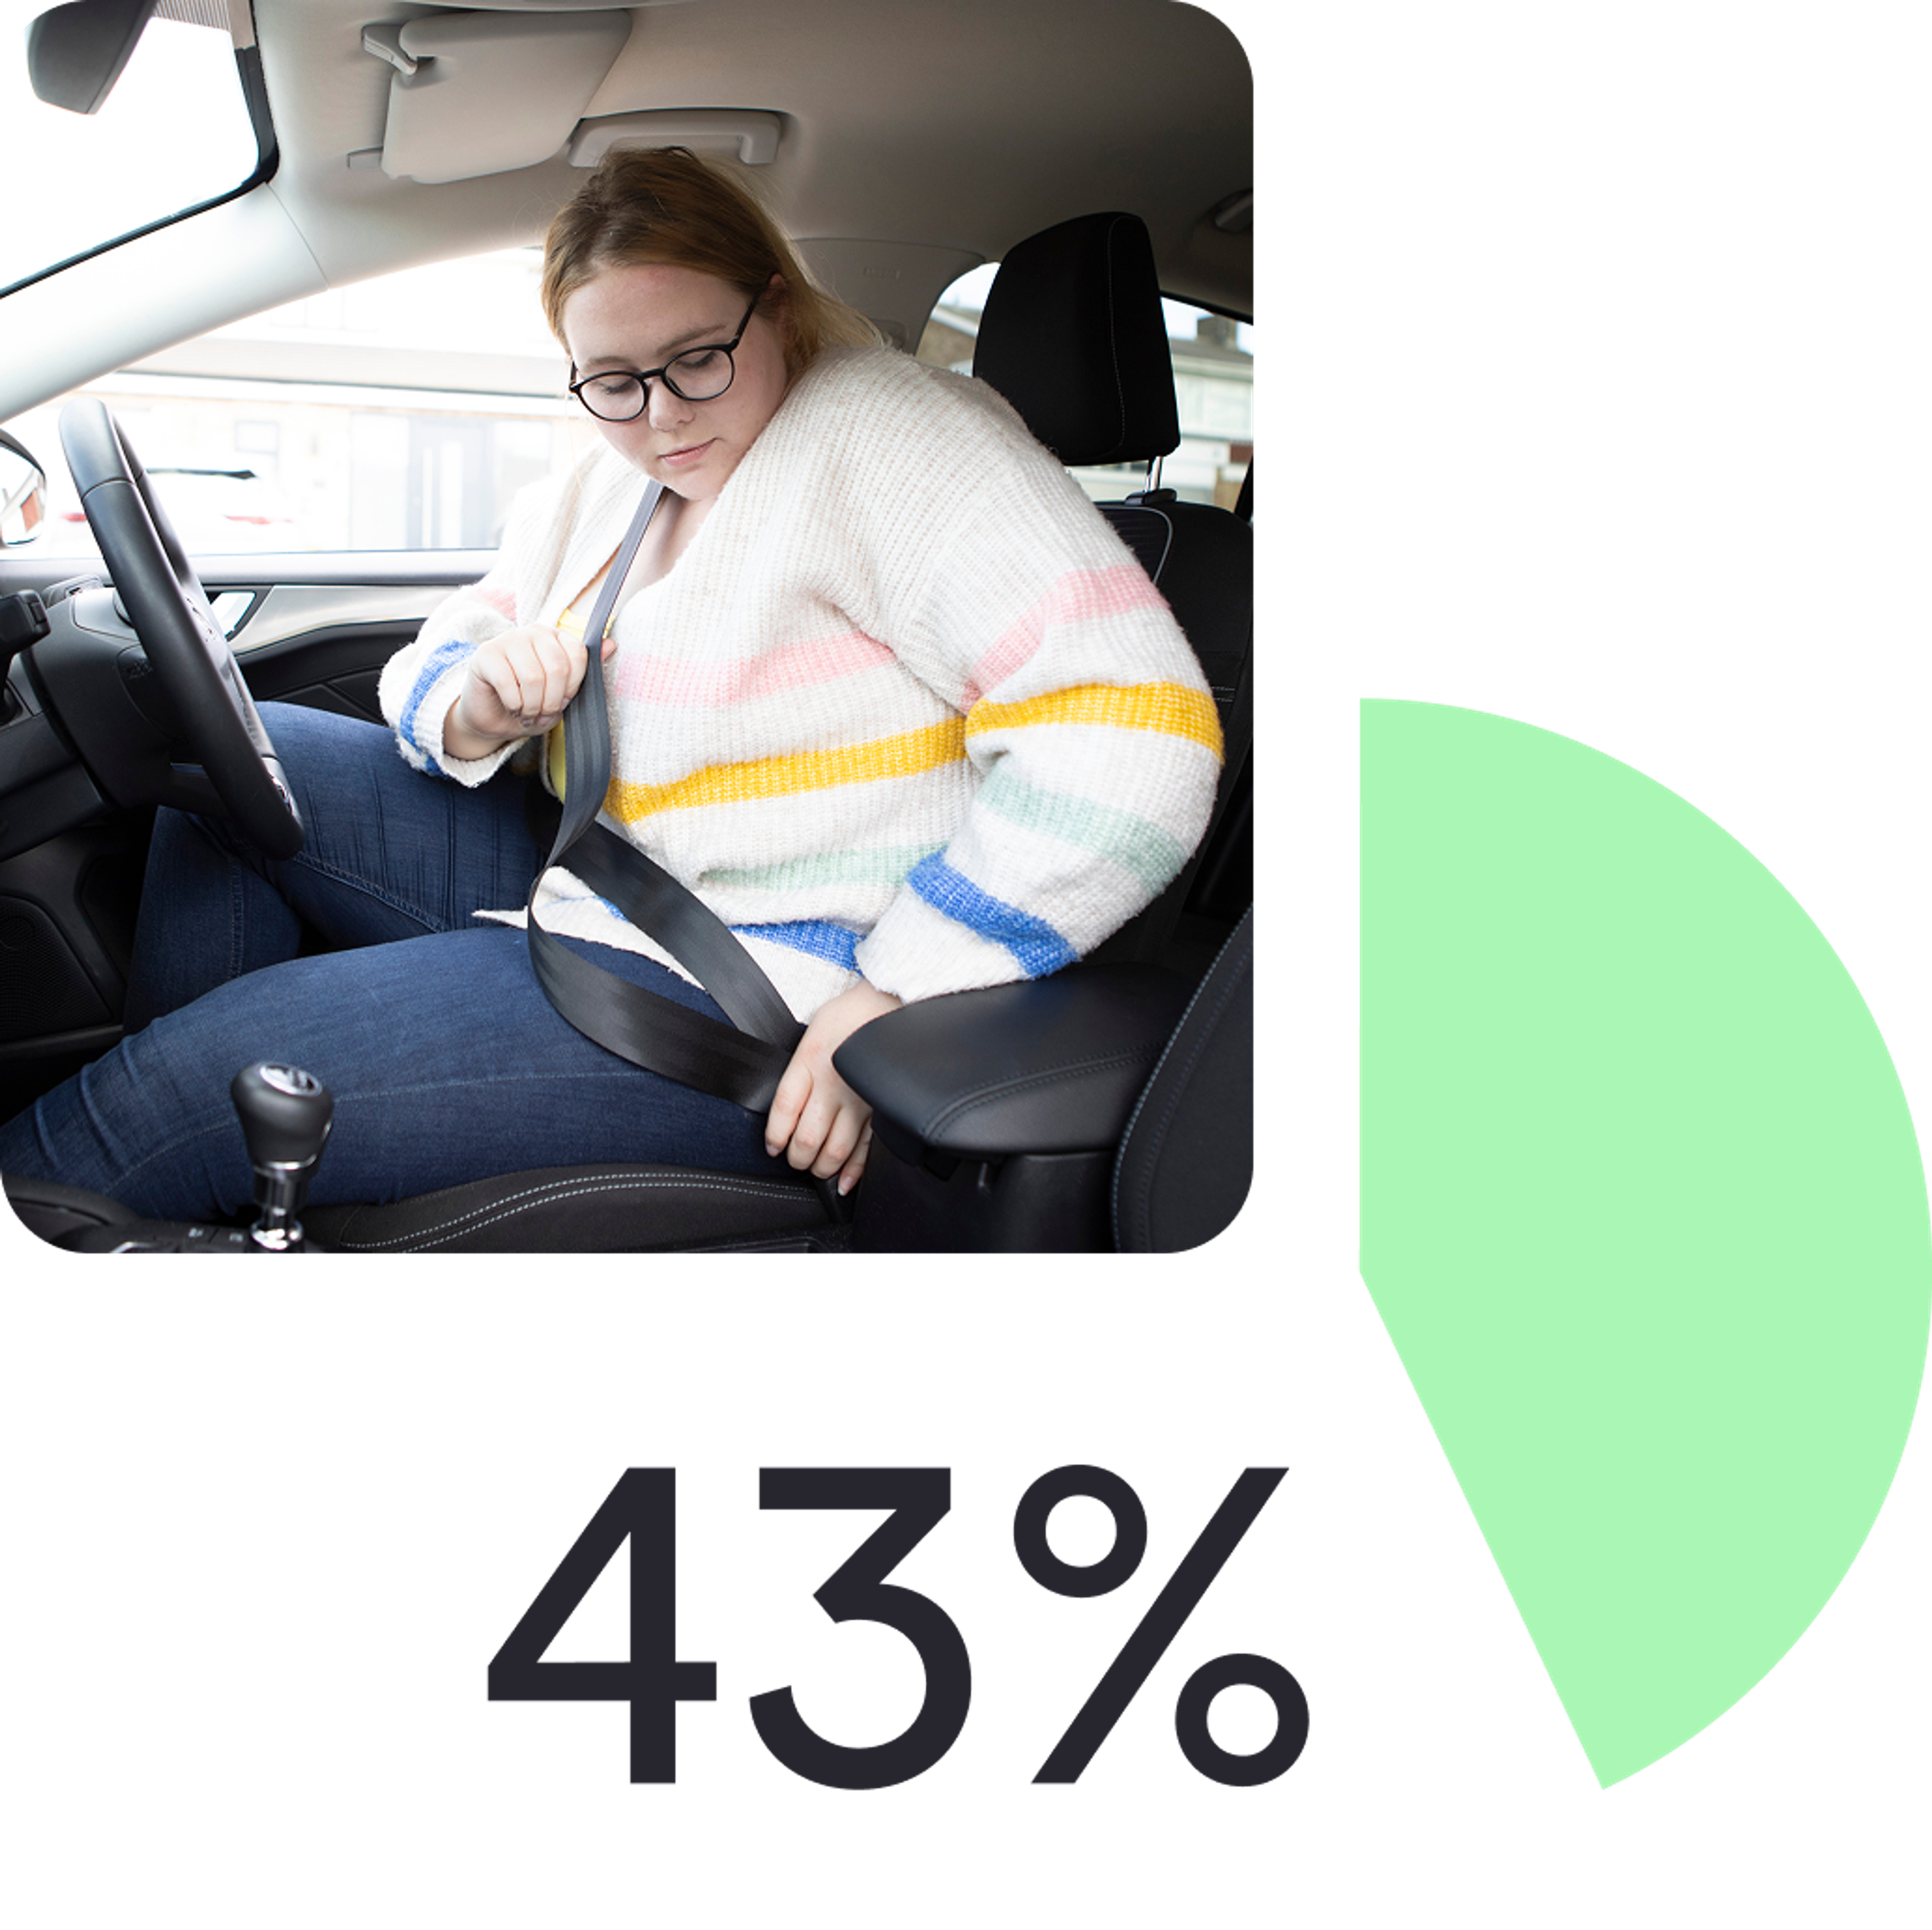
Among young drivers killed in 2021, 52% weren’t restrained – slightly higher than the 50% of all adult driver fatalities[2]. Male passengers dominate unbelted deaths: 68% of young unrestrained fatalities are male[26].
Insurance and financial impact
Premium pressure
In 2025, the average premium for 17-to-24-year-olds is £834, but 17-year-olds specifically can expect to pay £2,877[27].
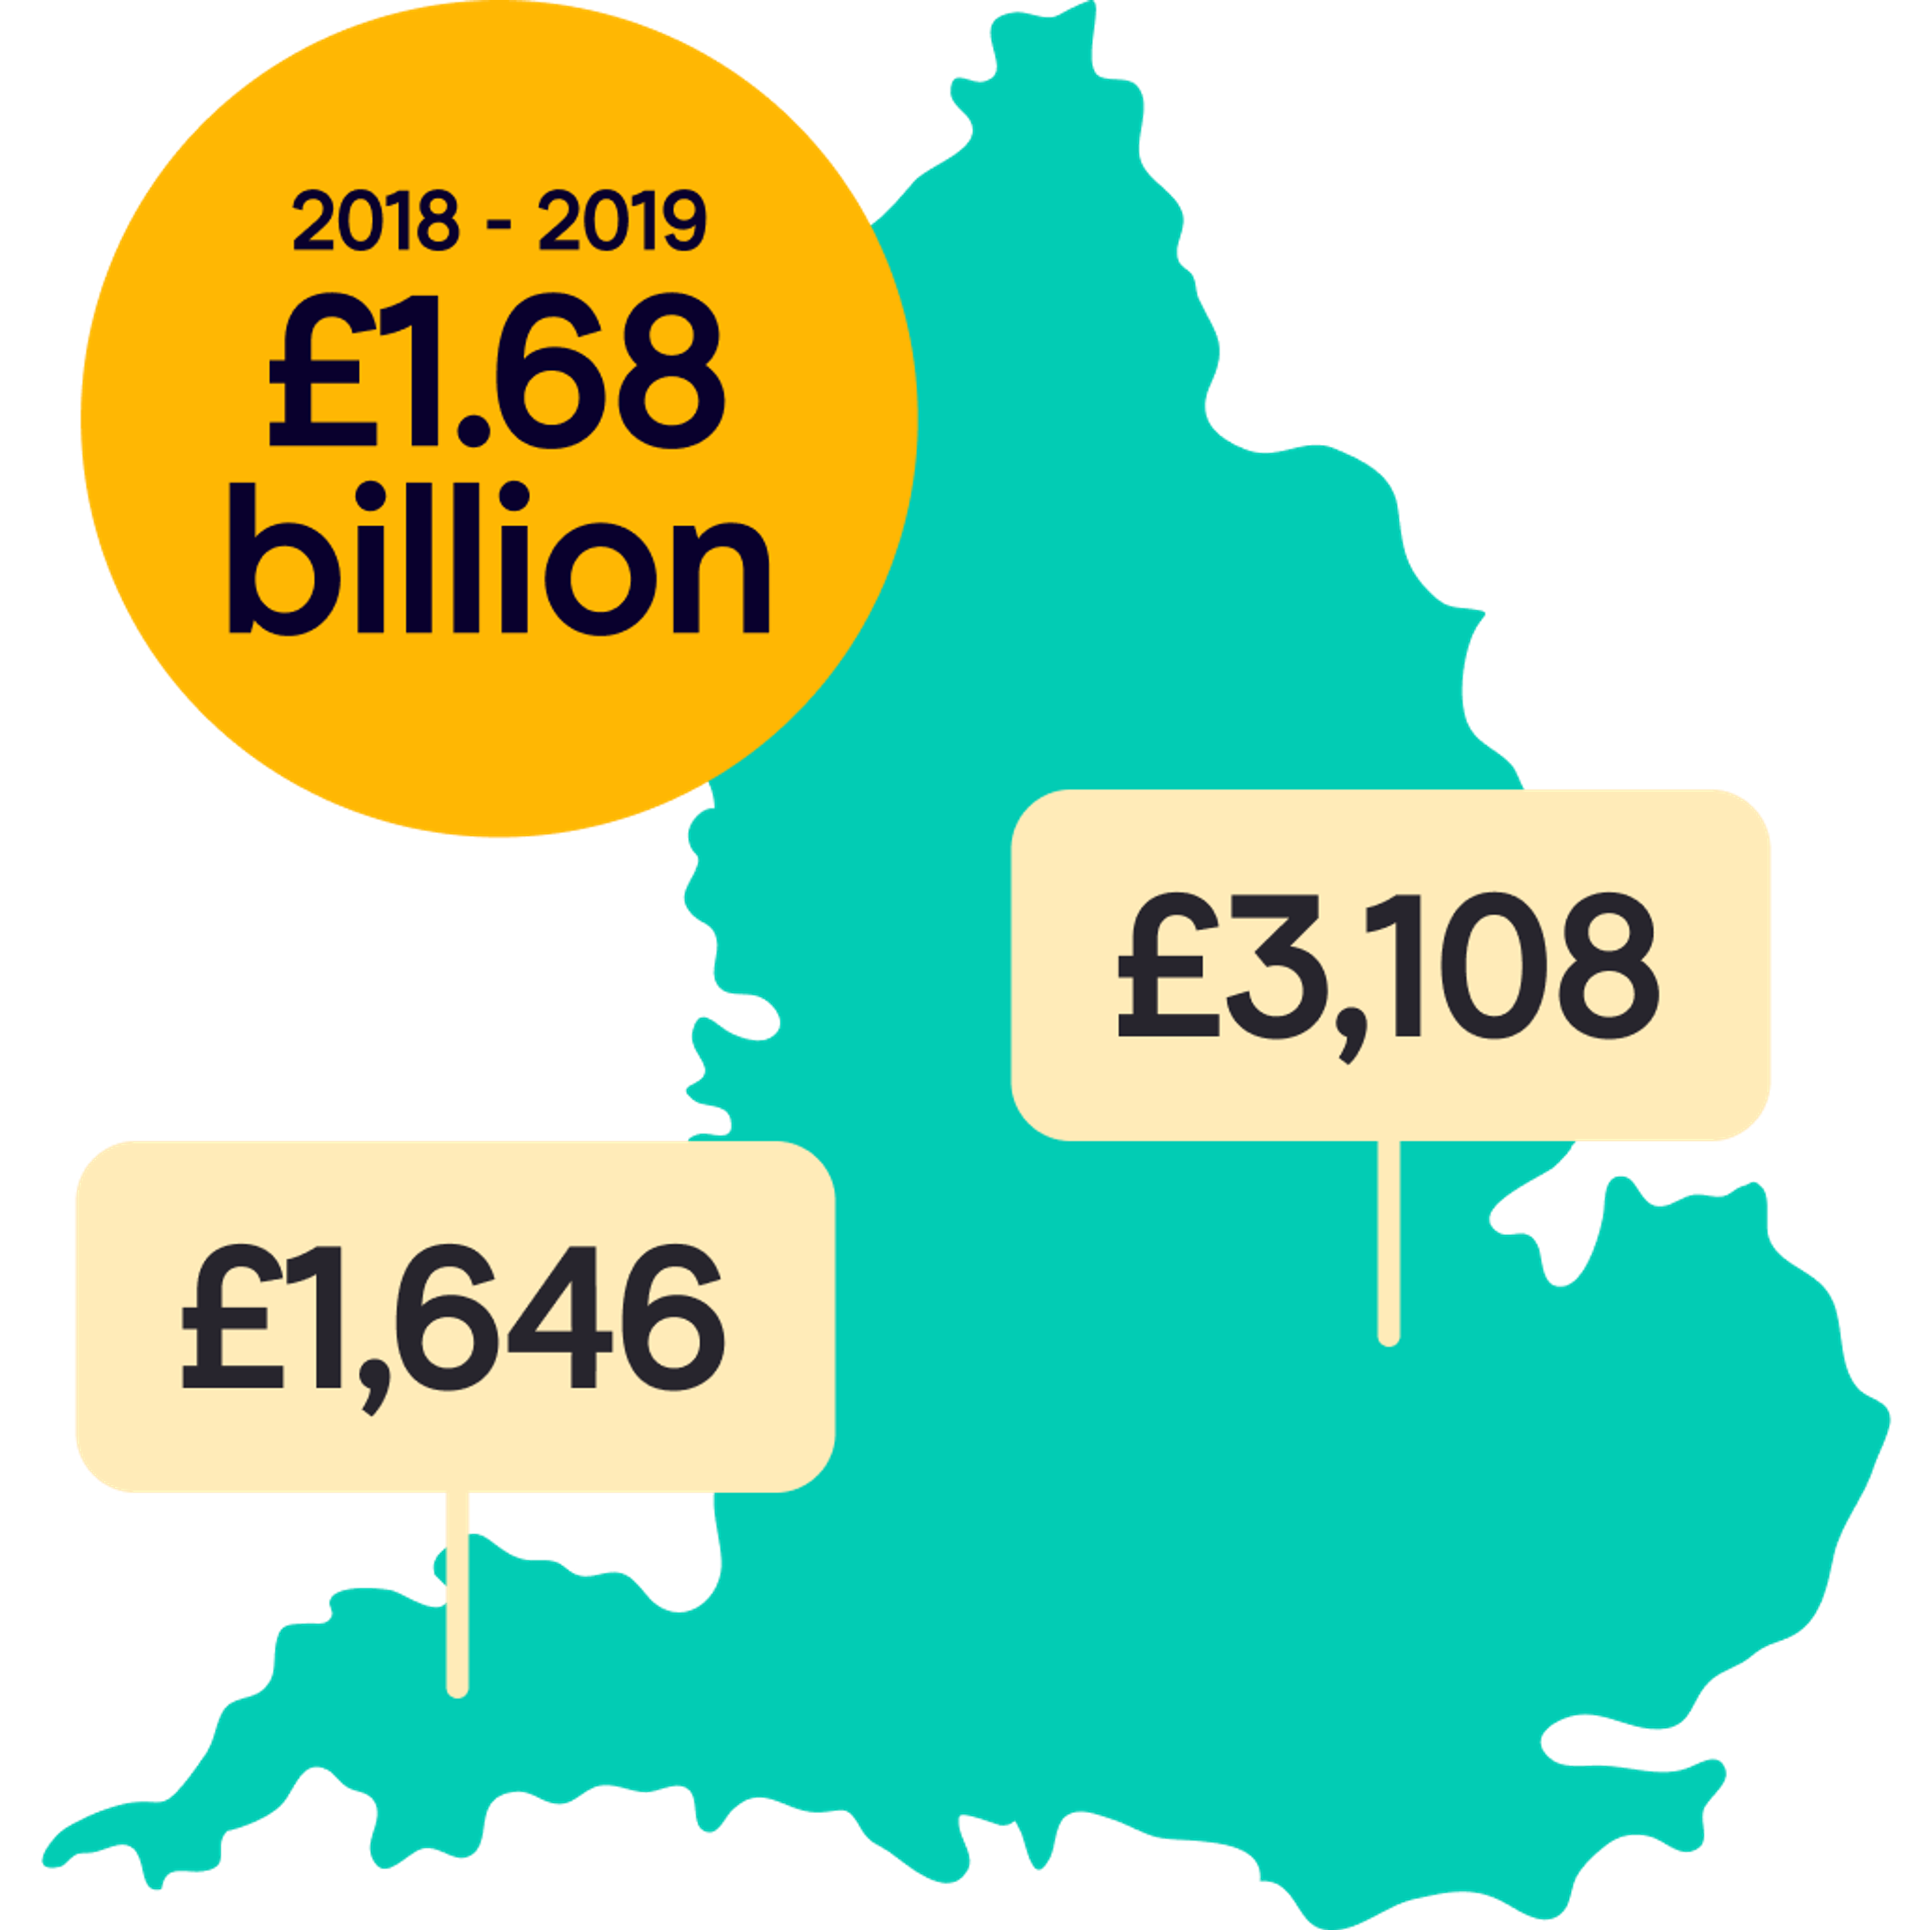
Young drivers in big cities like London, where roads are narrower and busier, face the highest bills (£3,108), while those in the South West pay tend to pay less (£1,646)[1].
Learning to drive isn’t cheap
Between 2018 and 2019, learner drivers in the UK spent a collective £1.68bn on learning how to drive[7].
View More UK Driving & Insurance Statistics
UK Driving Offence Statistics
Explore the latest UK driving offence statistics, including speeding, mobile phone offences, penalty points, age comparisons and regional hotspots.
Food Delivery Statistics
Dive into comprehensive food delivery statistics covering rider demographics, risk patterns, earnings and the growth of the UK delivery sector.
UK Van Driver Statistics
Learn more about the nation’s tradespeople through our detailed UK van driver statistics, including incident rates, mileage patterns and regional breakdowns.
Car Theft Statistics
Understand current UK trends, risk factors and the most-targeted models in our full car theft statistics guide.
Young Driver Statistics
Get insights into telematics behaviour, pass rates, claims data and insurance trends in our latest young driver statistics report.
Telematics insurance: A game-changer for young drivers
According to an analysis by LexisNexis Risk Solutions, the number of 17-to-19-year-olds killed or seriously injured in road crashes fell by 35% between 2011 and 2017[30]. That compares with just a 16% drop for the overall driving population.
This change coincides with a rise in telematics usage, with an estimated four in five young drivers now using a telematics-based policy[31].
In 2017 alone, there were 975,000 live telematics policies, almost covering the entire 17–19 age group[32]. During the same period, driving licences increased by 7% and vehicles on UK roads by 10%[33]. Despite these increases, serious injuries among young drivers continued to fall.
Telematics insurance isn’t just safer, but it’s cheaper. The cost of providing telematics has dropped by up to 50% since 2013, while these policies regularly rank as the most affordable options for young drivers[34].
The World Health Organisation highlights car accidents as the leading cause of death among teenagers[36]. Young drivers (17–24) account for only 7% of UK licence holders yet represent nearly 20% of those killed or seriously injured in road crashes[37]. They also make up 25% of all motor insurance claims, with average claims among this group reaching £4,625 – double that of drivers aged 51–70[38].
Tim Marlow, head of autonomous and connected vehicle research from Ageas, adds that telematics insurance doesn’t just help young people get insured, it helps them become safer drivers, and its benefits could extend to older age groups, too.
View More UK Driving & Insurance Statistics
If you’re looking for deeper insights into UK driving behaviour, insurance trends and road safety, explore our full library of data-led statistics pages. Each guide includes detailed figures, expert commentary and actionable takeaways for drivers, tradespeople and delivery workers.
UK Driving Offence Statistics
Explore the latest UK driving offence statistics, including speeding, mobile phone offences, penalty points, age comparisons and regional hotspots.
Food Delivery Statistics
Dive into comprehensive food delivery statistics covering rider demographics, risk patterns, earnings and the growth of the UK delivery sector.
UK Van Driver Statistics
Learn more about the nation’s tradespeople through our detailed UK van driver statistics, including incident rates, mileage patterns and regional breakdowns.
Car Theft Statistics
Understand current UK trends, risk factors and the most-targeted models in our full car theft statistics guide.
Young Driver Statistics
Get insights into telematics behaviour, pass rates, claims data and insurance trends in our latest young driver statistics report.
Gender Car Insurance Statistics
Discover how premiums vary across age groups and regions in our detailed gender car insurance statistics breakdown.